
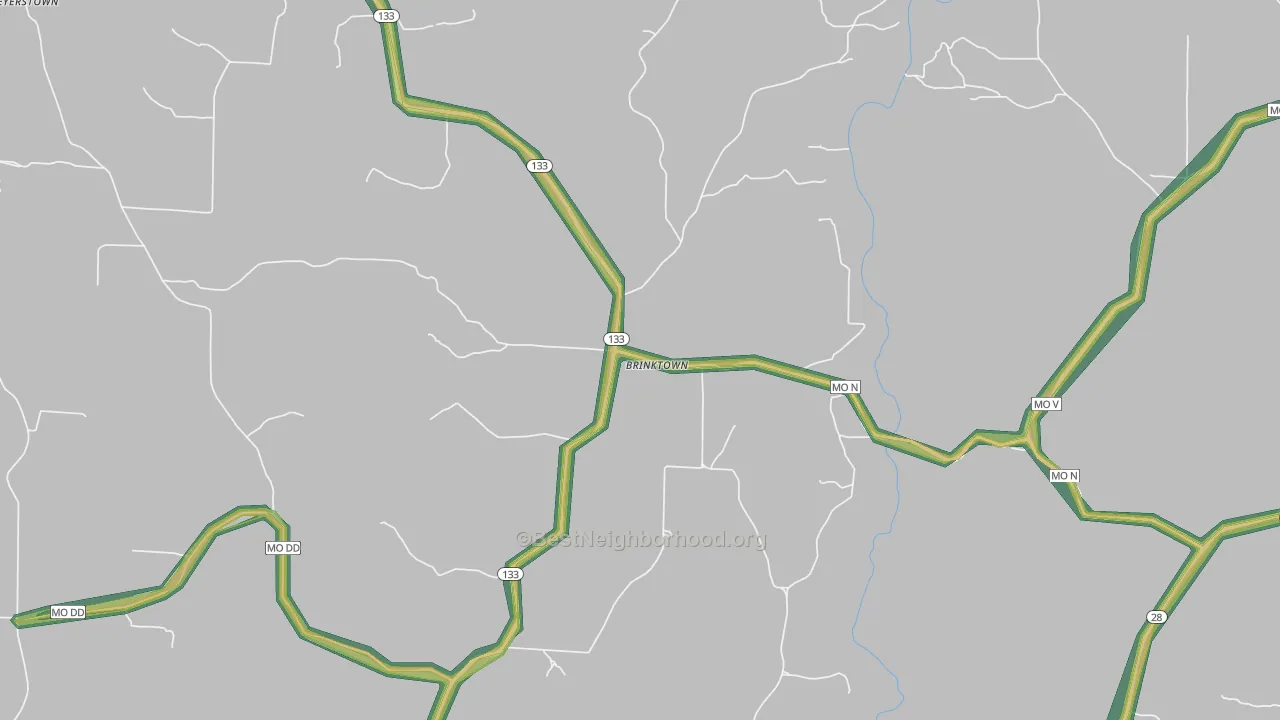
This map shows modeled outdoor noise across 65443 at 100-meter resolution, combining road, aviation, and rail sources. Green areas measure below 45 dBA. Orange and red exceed the EPA's 55 dBA outdoor threshold linked to long-term health effects. Use the layer toggles to view each source on its own or all together.
What the numbers sound like
- 30 dBAWhisper
- 40 dBASoft rainfall
- 45 dBAQuiet suburban street at night
- 50 dBAQuiet office
- 55 dBAEPA outdoor threshold: light traffic 100 ft away
- 60 dBANormal conversation an arm's length away
- 65 dBABusy restaurant
- 70 dBAHighway traffic 50 ft away
- 80 dBACity bus interior
Population Above the EPA Outdoor Threshold
The EPA's 55 dBA outdoor reference level is a common benchmark for residential noise exposure, especially for activity interference, annoyance, and long-term community noise concerns. About 4 65443 residents, or 3.4%, live above that level. By land area, 4.4% of 65443 is above 55 dBA.
See how noise in 65443 compares to similar-sized zip codes.
Average noise levels for 65443 residents, grouped by direction from the center of 65443. The highest population-weighted average is in ; the lowest is in , where just 0% of residents live in blocks above the EPA's 55 dBA threshold, the share in the loudest section.
To the human ear, noise in sounds about 0% louder than in , a 0.0 dBA gap. Every 10 dBA roughly doubles perceived loudness. Within any of these directions, two homes a quarter mile apart can still differ by 10 or more dBA depending on how close they sit to a major highway.