Noise Levels in Garwood, NJ | Find Quiet Neighborhoods With Our Sound Map
49 dBA
Average noise across Garwood
Quiet office
377
Residents above the EPA 55 dBA threshold
19% of Garwood residents
70 dBA
Loudest residential point
Highway traffic 50 ft away
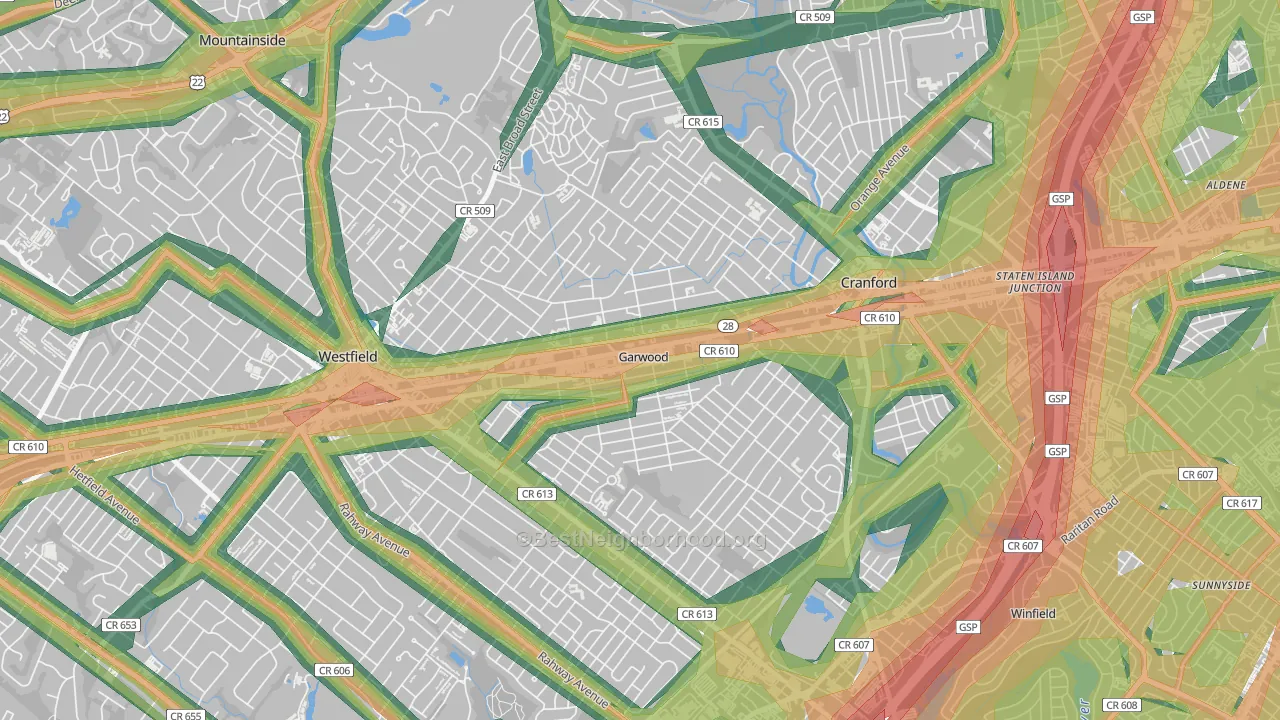
This map shows modeled outdoor noise across Garwood at 100-meter resolution, combining road, aviation, and rail sources. Green areas measure below 45 dBA. Orange and red exceed the EPA's 55 dBA outdoor threshold linked to long-term health effects. Use the layer toggles to view each source on its own or all together.
What the numbers sound like
- 30 dBAWhisper
- 40 dBASoft rainfall
- 45 dBAQuiet suburban street at night
- 50 dBAQuiet office
- 55 dBAEPA outdoor threshold: light traffic 100 ft away
- 60 dBANormal conversation an arm's length away
- 65 dBABusy restaurant
- 70 dBAHighway traffic 50 ft away
- 80 dBACity bus interior
Population Above the EPA Outdoor Threshold
The EPA's 55 dBA outdoor reference level is a common benchmark for residential noise exposure, especially for activity interference, annoyance, and long-term community noise concerns. About 377 Garwood residents, or 18.9%, live above that level. By land area, 26.9% of Garwood is above 55 dBA.
73.1% below 55 dBA
26.9% above 55 dBA
See how noise in Garwood compares to similar-sized cities.
Noise by Part of Garwood
Average noise levels for Garwood residents, grouped by direction from the center of Garwood. The highest population-weighted average is in central Garwood; the lowest is in southwestern Garwood, where just 10% of residents live in blocks above the EPA's 55 dBA threshold, a third of the share in the loudest section.
Central Garwood
55.6 dBA · Moderate-loud
Quiet office to normal conversation
Western Garwood
54.8 dBA · Moderate-loud
Quiet office to normal conversation
Northeastern Garwood
54.7 dBA · Moderate-loud
Quiet office to normal conversation
Southwestern Garwood
49.5 dBA · Mostly quiet
Quiet office
To the human ear, noise in central Garwood sounds about 53% louder than in southwestern Garwood, a 6.1 dBA gap. Every 10 dBA roughly doubles perceived loudness. Within any of these directions, two homes a quarter mile apart can still differ by 10 or more dBA depending on how close they sit to a major highway.
How far back from do you need to be?
produces an estimated 70 dBA at its loudest centerline points. Noise drops logarithmically with distance, with the exact rate depending on what's between you and the road. Tree cover, walls, terrain, and pavement type all matter. At roughly a quarter mile back, traffic fades into the noise level of a soft rainfall.
At source
70 dBA
Highway traffic 50 ft away
165 ft
57 dBA
Normal conversation an arm’s length away
330 ft
49 dBA
Quiet office
660 ft
42 dBA
Quiet suburban street at night
¼ mile
35 dBA
Soft rainfall
½ mile
35 dBA
Soft rainfall
Calculated from the model's calibrated attenuation formula. About 25% of Garwood sits under tree canopy (about average for cities) and roughly 43% is impervious surface like pavement and rooftops. Both are folded into the per-place decay rate above. Heavier canopy pulls noise down faster with distance; impervious surfaces slow the drop.
-->
Rail Noise
Active freight rail runs through parts of Garwood. For most blocks the rail-only contribution is small. Combined road-plus-rail noise rarely exceeds road noise on its own. The exceptions are the handful of blocks within roughly a quarter mile of the right-of-way during pass-through hours.
Use the Rail toggle on the map above to isolate rail's contribution from road and aviation.
Airport Noise
Newark Liberty International (EWR) sits east of Garwood. The U.S. Department of Transportation measures aviation noise around this airport directly, and the model uses those federal measurements rather than synthetic predictions.
Blocks under the approach and departure paths carry combined road-plus-aviation noise, with some exceeding 75 dBA on the map's Overall layer. Blocks on the opposite side of Garwood, particularly to the west, show no measurable aviation contribution. Use the Aviation toggle on the map above to isolate the airport's footprint.
How Noise Is Distributed Across Garwood
The bar chart below shows the share of Garwood residents in each noise band. About 69% of residents live below the EPA's 55 dBA threshold, and roughly 3% live in blocks above 60 dBA. Long-term exposure in that range is linked to elevated stress hormones and cardiovascular risk.
How Garwood Compares
Garwood sits the lowest among the peer group. Below: how Garwood's average outdoor noise and share of residents above the EPA threshold compare with Stirling, Sewaren, Port Reading, and Vauxhall.
Average noise level (dBA)
Garwood's 49.0 dBA pop-weighted average is the lowest among the peer group. New Jersey as a whole averages 49.8 dBA and the U.S. averages 52.0 dBA. Both are lower than Garwood because most of either area is rural land away from major roads.
Share of residents above 55 dBA
About 18.9% of Garwood residents live in blocks where outdoor levels exceed the EPA's 55 dBA threshold. That's fewer than any of its peer group. Measured by land area instead, 26.9% of Garwood's footprint sits above 55 dBA, against a New Jersey average of 25.2% and a national average of 28.1%.
What This Means if You're Moving to Garwood
- Distance from highways matters more than the neighborhood name. Two homes in the same zip code can differ by 20 dBA if one sits 100 meters from and the other 500 meters away. The model captures this at 100-meter resolution, so noise exposure changes block by block.
- Tree canopy can help reduce modeled noise exposure. Roughly 25% of Garwood is under tree cover (about average for cities), and the dominant land cover is low-intensity developed land. Both are measured from federal USDA Forest Service and USGS satellite imagery at 30-meter resolution. Streets with 60% or higher canopy show 3 to 5 dBA lower noise than comparable streets with bare ground or pavement, which is why the per-place decay rate above already accounts for it.
- Airport noise is directional. Newark Liberty International's approach paths concentrate aviation noise to the east. Neighborhoods to the west of downtown show no measurable contribution from the airport.