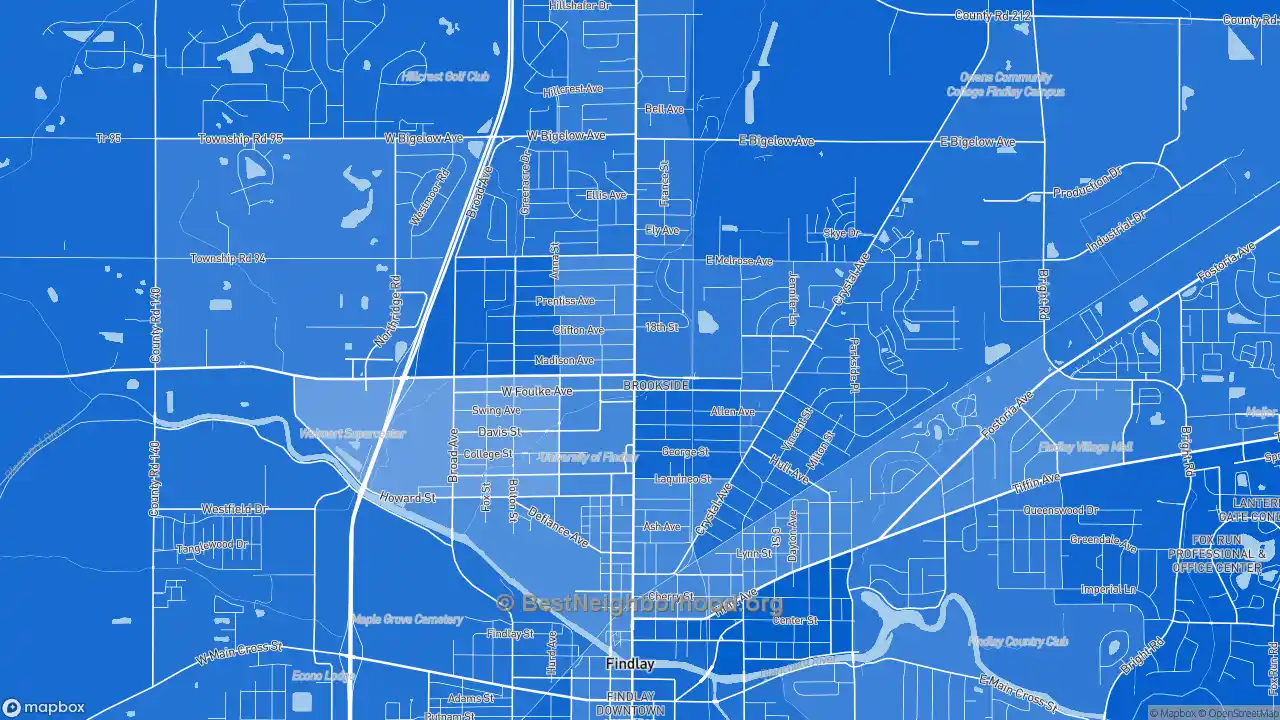
The map below shows majority race by area in Brookside, as self-identified on the US census. Darker shades indicate a larger racial majority in that neighborhood. This page also contains data and maps on Brookside racial diversity and diversity scores. Click here to scroll to diversity data.
WhiteHispanicBlackAsianMultiple/Other
Majority race by area
The majority race in Brookside overall is white, making up 82.9% of residents. The next most-common racial group is hispanic at 12.4%. There are more white people in the southeast areas of the neighborhood. People who identify as hispanic are most likely to be living in the southwest places. The data below shows how many people identify themselves as each of the following races, which most Americans base on their family's national origin:
Race in Brookside
Self-Identified Race |
Brookside, Findlay, OH Population |
|---|---|
White |
82.9% |
Hispanic |
12.4% |
Black |
2.0% |
Asian |
1.2% |
Native American |
0.0% |
Other |
1.6% |
Diversity and Diversity Scores for Brookside, Findlay, OH
The map below shows diversity in Brookside. Areas in green are more diverse, while areas in red are much less diverse. Diversity, in this case, means a mixture of people with different race and ethnicity living close to one another. For example, all-black and all-white areas in the neighborhood would both be considered lacking diversity.

More diverse
Less diverse
Colorblind friendly
off
Brookside Diversity Score
12
With a diversity score of 12 out of 100, Brookside is much less diverse than other US neighborhoods. The most diverse area within Brookside's proper boundaries is to the southwest of the neighborhood. The least diverse areas are located in the southeast parts of Brookside.
Data Sources: U.S. Census, proprietary data mapping and analysis. Special thanks to the University of Virginia.
Nearby Neighborhoods
- Findlay Downtown Historic District, Findlay, OH: less diverse
- Downtown Fostoria, Fostoria, OH: more diverse
- Perrysburg Historic District, Perrysburg, OH: more diverse
- Downtown Fremont Historic District, Fremont, OH: more diverse
- Maumee Uptown Historic District, Maumee, OH: less diverse
- Southwyck, Toledo, OH: more diverse
- Bucyrus Commercial Historical District, Bucyrus, OH: less diverse
- Holgate Avenue Historic District, Defiance, OH: more diverse
- Downtown Marion, Marion, OH: less diverse
- Shelby Center Historic District, Shelby, OH: less diverse
Neighborhoods with Similar Populations
- Kendall, San Bernardino, CA: more diverse
- Shelby Center Historic District, Shelby, OH: less diverse
- Samish Hill, Bellingham, WA: more diverse
- Ruskin Heights, Kansas City, MO: more diverse
- North Central Loma Linda, Loma Linda, CA: more diverse
- Marina West, Oxnard, CA: more diverse
- Malletts Bay, Colchester, VT: less diverse
- Lasell Village, Auburndale, MA: more diverse
- Lakeshore-Oakland, Oakland, CA: more diverse
- Silver Valley Addition, Sioux Falls, SD: less diverse