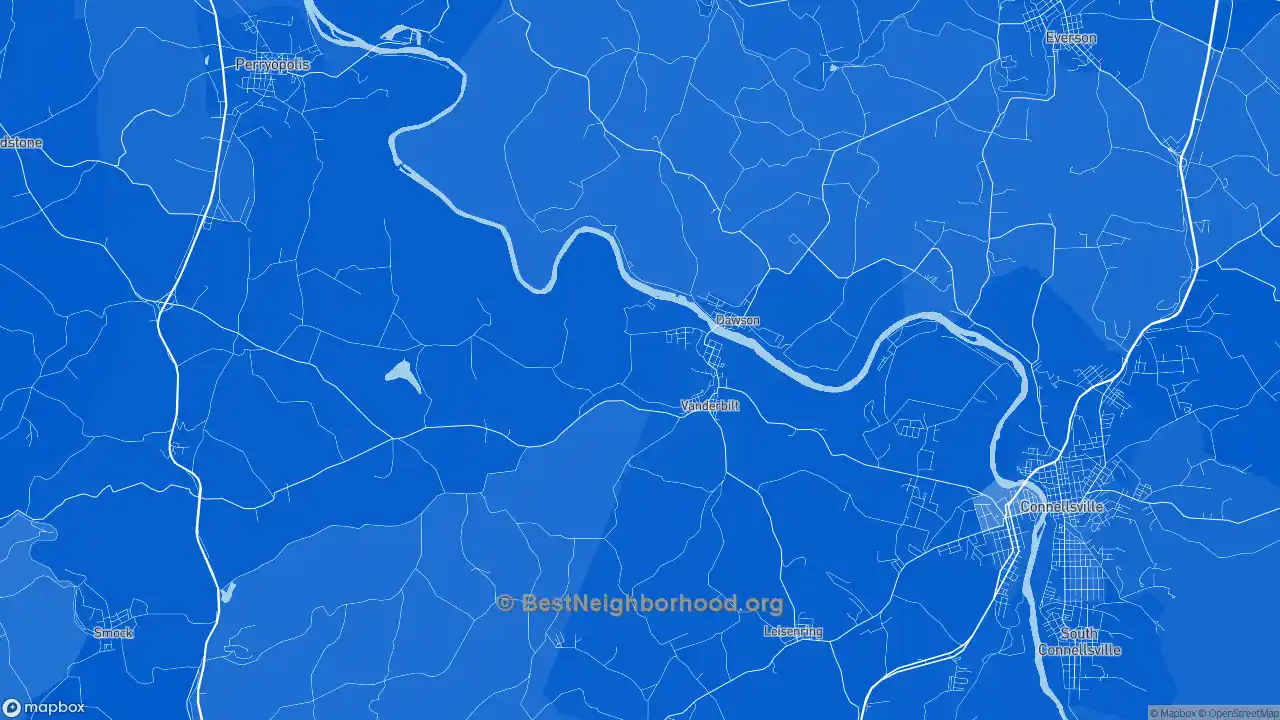
The map below shows majority race by area in Dickerson Run, as self-identified on the US census. Darker shades indicate a larger racial majority in that neighborhood. This page also contains data and maps on Dickerson Run racial diversity and diversity scores. Click here to scroll to diversity data.
WhiteHispanicBlackAsianMultiple/Other
Majority race by area
The majority race in Dickerson Run overall is white, making up 96.5% of residents. The next most-common racial group is other at 2.1%. There are more white people in the southwest areas of the city. People who identify as other are most likely to be living in the central places. The data below shows how many people identify themselves as each of the following races, which most Americans base on their family's national origin:
Race in Dickerson Run
Self-Identified Race |
Dickerson Run, PA Population |
|---|---|
White |
96.5% |
Hispanic |
0.7% |
Black |
0.1% |
Asian |
0.3% |
Native American |
0.4% |
Other |
2.1% |
Diversity and Diversity Scores for Dickerson Run, PA
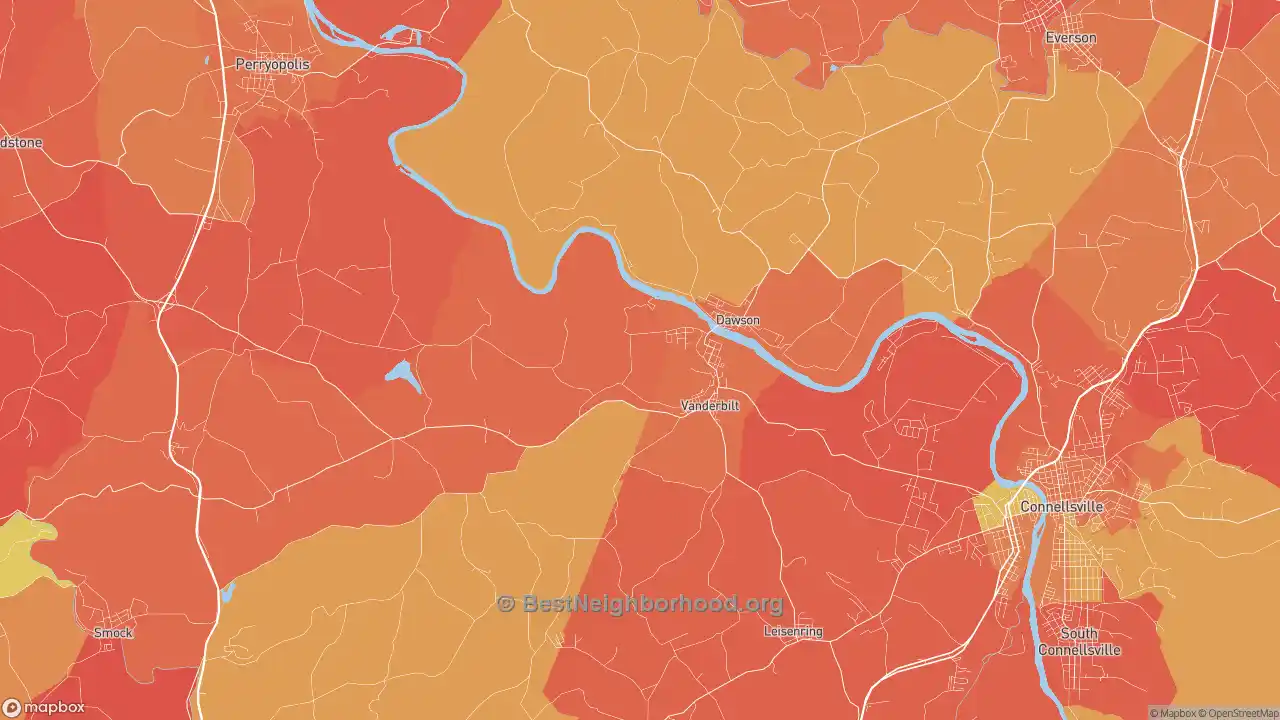
The map below shows diversity in Dickerson Run. Areas in green are more diverse, while areas in red are much less diverse. Diversity, in this case, means a mixture of people with different race and ethnicity living close to one another. For example, all-black and all-white areas in the city would both be considered lacking diversity.
More diverse
Less diverse
Colorblind friendly
off
Dickerson Run Diversity Score
22
With a diversity score of 22 out of 100, Dickerson Run is less diverse than other US cities. The most diverse area within Dickerson Run's proper boundaries is to the central of the city. The least diverse areas are located in the southwest parts of Dickerson Run.
Data Sources: U.S. Census, proprietary data mapping and analysis. Special thanks to the University of Virginia.