The map below shows majority race by area in East Dedham, as self-identified on the US census. Darker shades indicate a larger racial majority in that neighborhood. This page also contains data and maps on East Dedham racial diversity and diversity scores. Click here to scroll to diversity data.
WhiteHispanicBlackAsianMultiple/Other
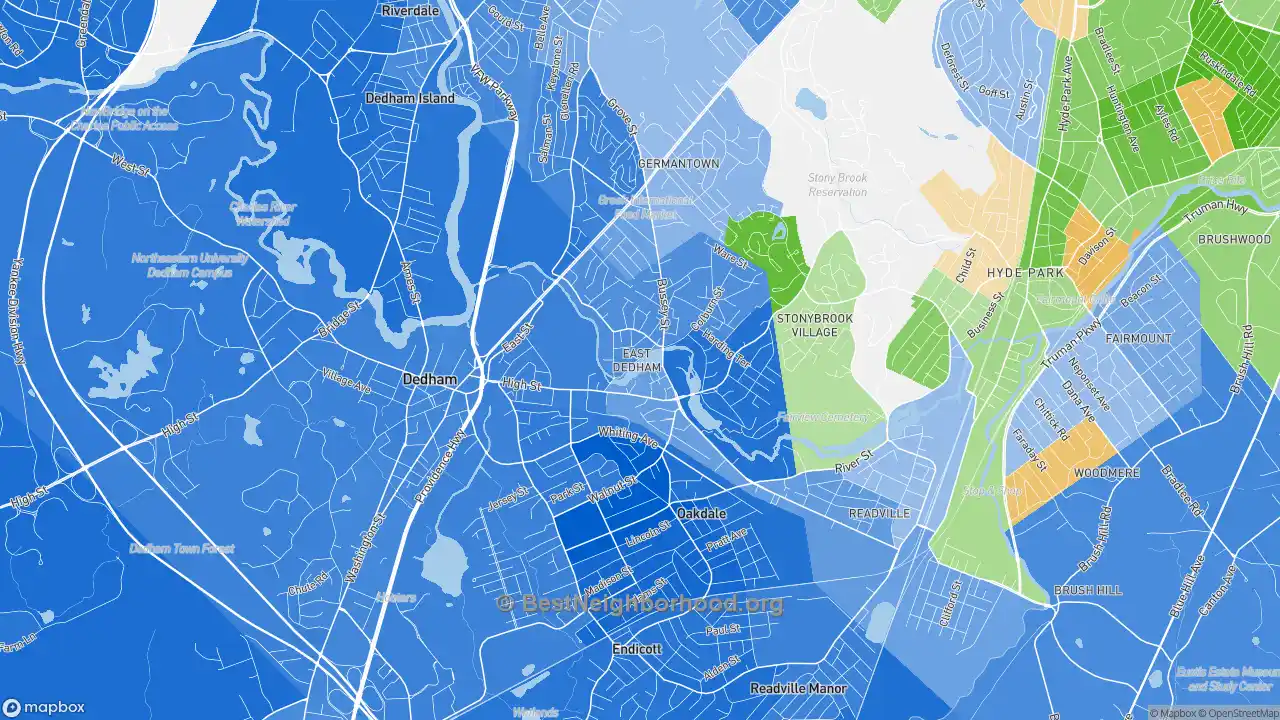
Majority race by area
The majority race in East Dedham overall is white, making up 73.6% of residents. The next most-common racial group is hispanic at 13.7%. There are more white people in the east areas of the neighborhood. People who identify as hispanic are most likely to be living in the west places. The data below shows how many people identify themselves as each of the following races, which most Americans base on their family's national origin:
Race in East Dedham
Self-Identified Race |
East Dedham, Dedham, MA Population |
|---|---|
White |
73.6% |
Hispanic |
13.7% |
Black |
8.7% |
Asian |
1.1% |
Native American |
0.0% |
Other |
2.9% |
Diversity and Diversity Scores for East Dedham, Dedham, MA
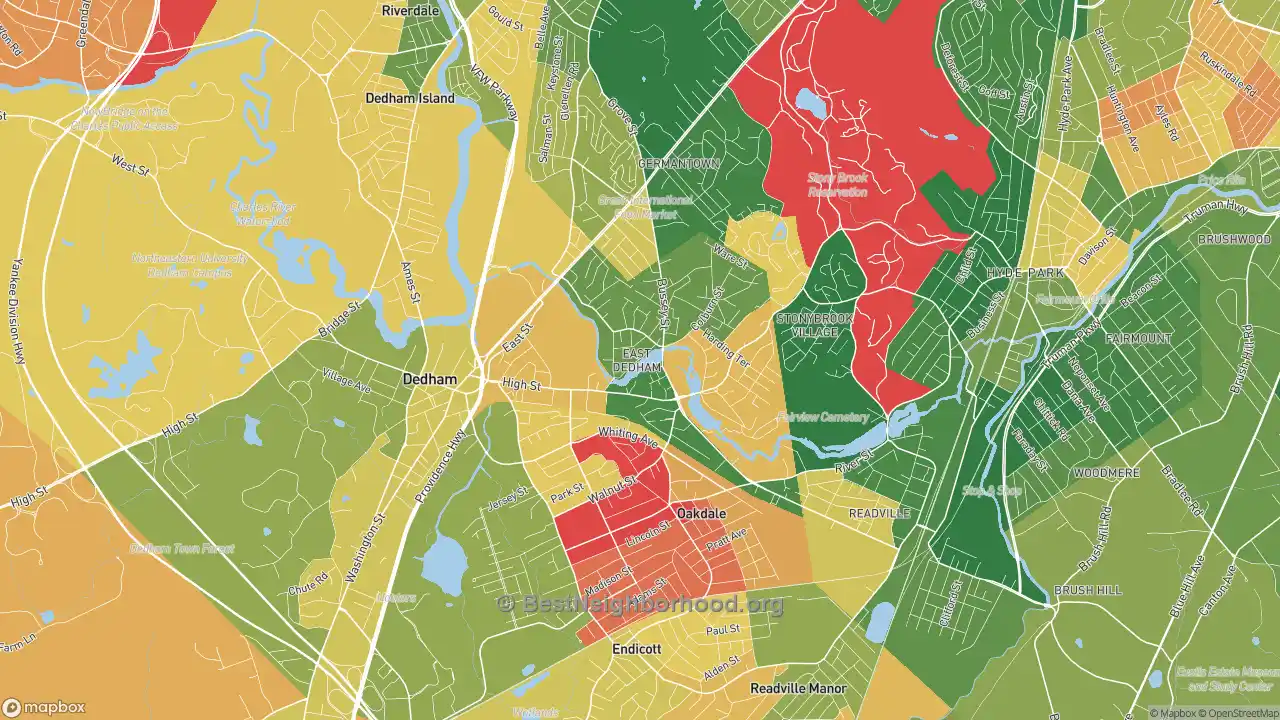
The map below shows diversity in East Dedham. Areas in green are more diverse, while areas in red are much less diverse. Diversity, in this case, means a mixture of people with different race and ethnicity living close to one another. For example, all-black and all-white areas in the neighborhood would both be considered lacking diversity.
More diverse
Less diverse
Colorblind friendly
off
East Dedham Diversity Score
37
With a diversity score of 37 out of 100, East Dedham is less diverse than other US neighborhoods. The most diverse area within East Dedham's proper boundaries is to the central of the neighborhood. The least diverse areas are located in the east parts of East Dedham.
Data Sources: U.S. Census, proprietary data mapping and analysis. Special thanks to the University of Virginia.
Nearby Neighborhoods
- Greendale Village, Needham, MA: less diverse
- Milton Upper Mills, Milton, MA: more diverse
- Forest Hills, Jamaica Plain, MA: more diverse
- Oak Hill, Newton Center, MA: less diverse
- Dorchester Center, Boston, MA: more diverse
- Thompsonville, Newton, MA: more diverse
- Mount Bowdoin, Boston, MA: more diverse
- South Dorchester, Boston, MA: more diverse
- East Milton, Milton, MA: less diverse
- Brookline Village, Brookline, MA: more diverse
Neighborhoods with Similar Populations
- Marriott's Griffin Gate Golf Culb, Lexington, KY: more diverse
- Redwood Heights, Oakland, CA: more diverse
- Rancho El Dorado, Silver Bell, AZ: more diverse
- Pocono Farms, Tobyhanna, PA: more diverse
- Plum Orchard, New Orleans, LA: less diverse
- Park West, Milwaukee, WI: less diverse
- Old Town, Eureka, CA: more diverse
- Oakhurst, Decatur, GA: more diverse
- Normandy Isles, North Bay Village, FL: less diverse
- New Aurora, New Orleans, LA: more diverse