The map below shows majority race by area in Egger Highlands, as self-identified on the US census. Darker shades indicate a larger racial majority in that neighborhood. This page also contains data and maps on Egger Highlands racial diversity and diversity scores. Click here to scroll to diversity data.
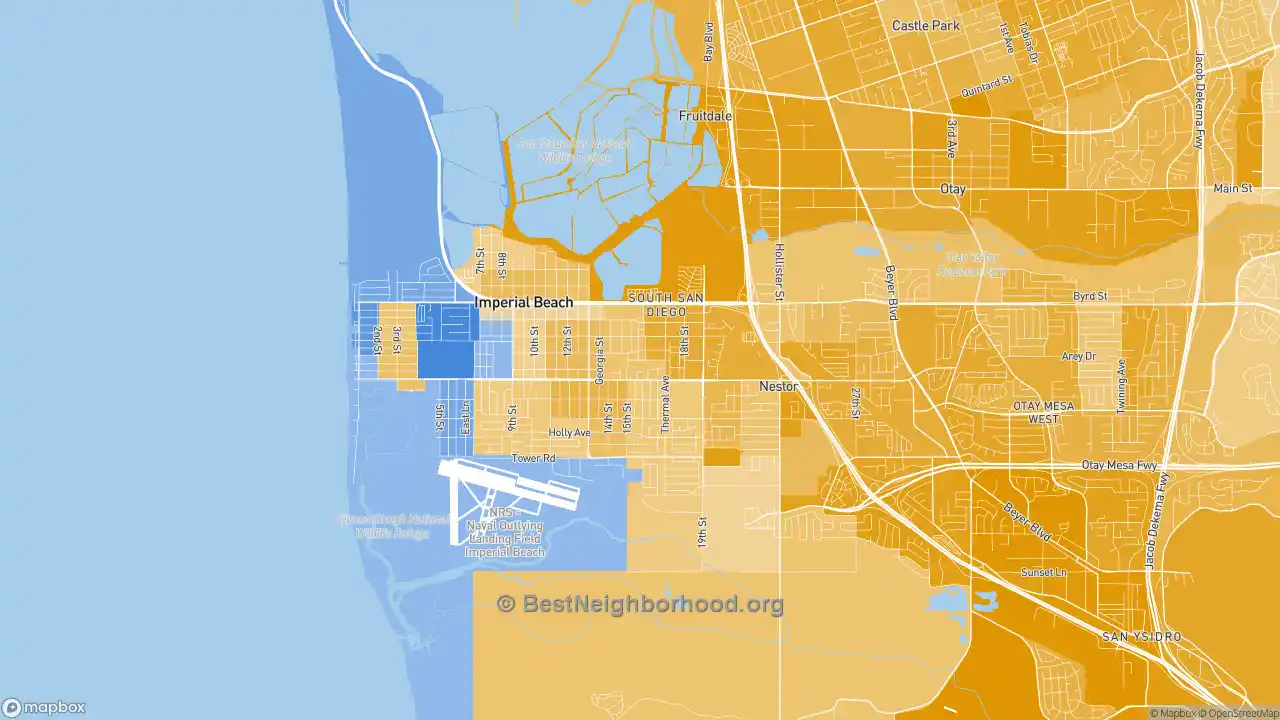
WhiteHispanicBlackAsianMultiple/Other
Majority race by area
The majority race in Egger Highlands overall is hispanic, making up 74.6% of residents. The next most-common racial group is white at 14.3%. There are more hispanic people in the north areas of the neighborhood. People who identify as white are most likely to be living in the northwest places. The data below shows how many people identify themselves as each of the following races, which most Americans base on their family's national origin:
Race in Egger Highlands
Self-Identified Race |
Egger Highlands, San Diego, CA Population |
|---|---|
White |
14.3% |
Hispanic |
74.6% |
Black |
4.5% |
Asian |
3.6% |
Native American |
0.4% |
Other |
2.6% |
Diversity and Diversity Scores for Egger Highlands, San Diego, CA
The map below shows diversity in Egger Highlands. Areas in green are more diverse, while areas in red are much less diverse. Diversity, in this case, means a mixture of people with different race and ethnicity living close to one another. For example, all-black and all-white areas in the neighborhood would both be considered lacking diversity.
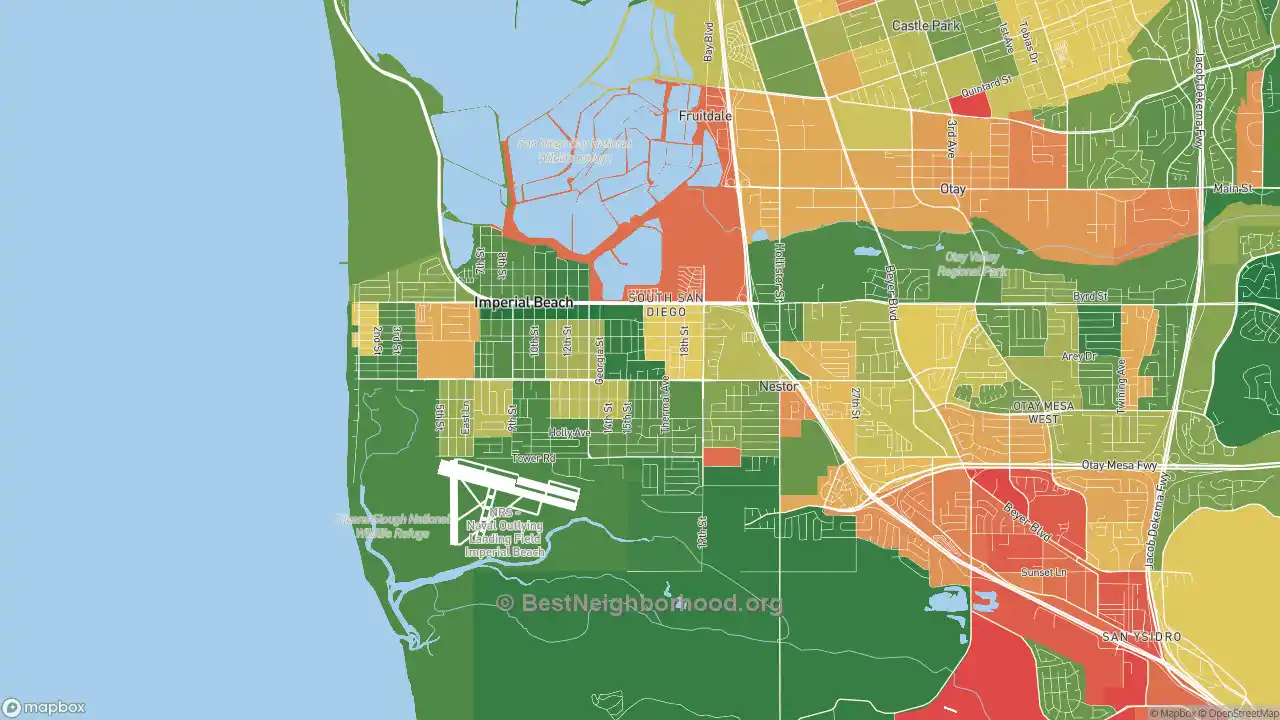
More diverse
Less diverse
Colorblind friendly
off
Egger Highlands Diversity Score
41
With a diversity score of 41 out of 100, Egger Highlands is about average for diversity versus other US neighborhoods. The most diverse area within Egger Highlands's proper boundaries is to the west of the neighborhood. The least diverse areas are located in the north parts of Egger Highlands.
Data Sources: U.S. Census, proprietary data mapping and analysis. Special thanks to the University of Virginia.
Nearby Neighborhoods
- Nestor, San Diego, CA: less diverse
- Palm City, San Diego, CA: more diverse
- Boal, Chula Vista, CA: less diverse
- Otay Mesa West, San Diego, CA: less diverse
- Mission Bay, San Diego, CA: more diverse
- Downtown Chula Vista, Chula Vista, CA: less diverse
- Sunbow, Chula Vista, CA: more diverse
- Lynwood Hills, Chula Vista, CA: more diverse
- Terra Nova, Chula Vista, CA: more diverse
- Paseo Ranchoero, Chula Vista, CA: more diverse
Neighborhoods with Similar Populations
- Family Acres, Lincoln, NE: less diverse
- Atlantic Beaches, Atlantic Beach, FL: less diverse
- River Mountain, Little Rock, AR: less diverse
- South Redlands, Redlands, CA: more diverse
- Sky Line, San Diego, CA: more diverse
- Baldwin Park, Orlando, FL: more diverse
- Congress Heights, Washington, DC: less diverse
- Jenkins-Pinecroft, Shreveport, LA: less diverse
- Martin Luther King, Austin, TX: more diverse
- Parkrose, Portland, OR: more diverse