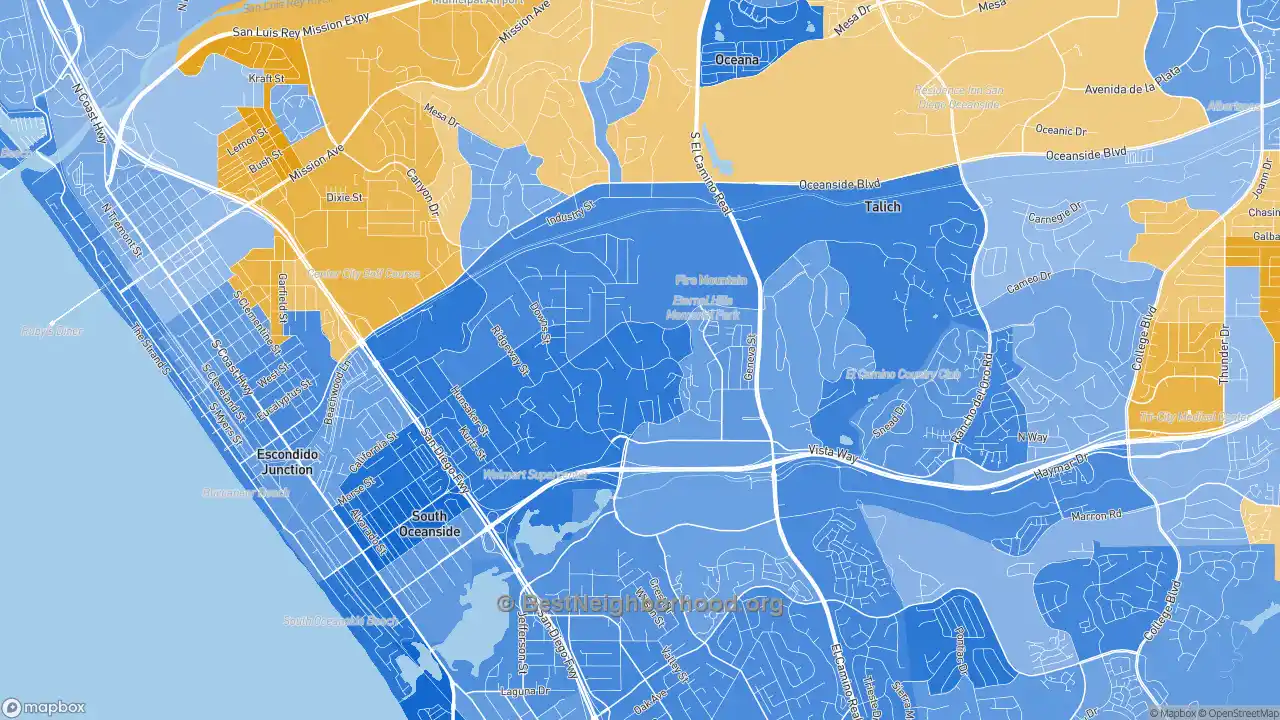
The map below shows majority race by area in Fire Mountain, as self-identified on the US census. Darker shades indicate a larger racial majority in that neighborhood. This page also contains data and maps on Fire Mountain racial diversity and diversity scores. Click here to scroll to diversity data.
WhiteHispanicBlackAsianMultiple/Other
Majority race by area
The majority race in Fire Mountain overall is white, making up 69.1% of residents. The next most-common racial group is hispanic at 24.8%. There are more white people in the southwest areas of the neighborhood. People who identify as hispanic are most likely to be living in the central places. The data below shows how many people identify themselves as each of the following races, which most Americans base on their family's national origin:
Race in Fire Mountain
Self-Identified Race |
Fire Mountain, Oceanside, CA Population |
|---|---|
White |
69.1% |
Hispanic |
24.8% |
Black |
1.4% |
Asian |
2.1% |
Native American |
0.0% |
Other |
2.5% |
Diversity and Diversity Scores for Fire Mountain, Oceanside, CA
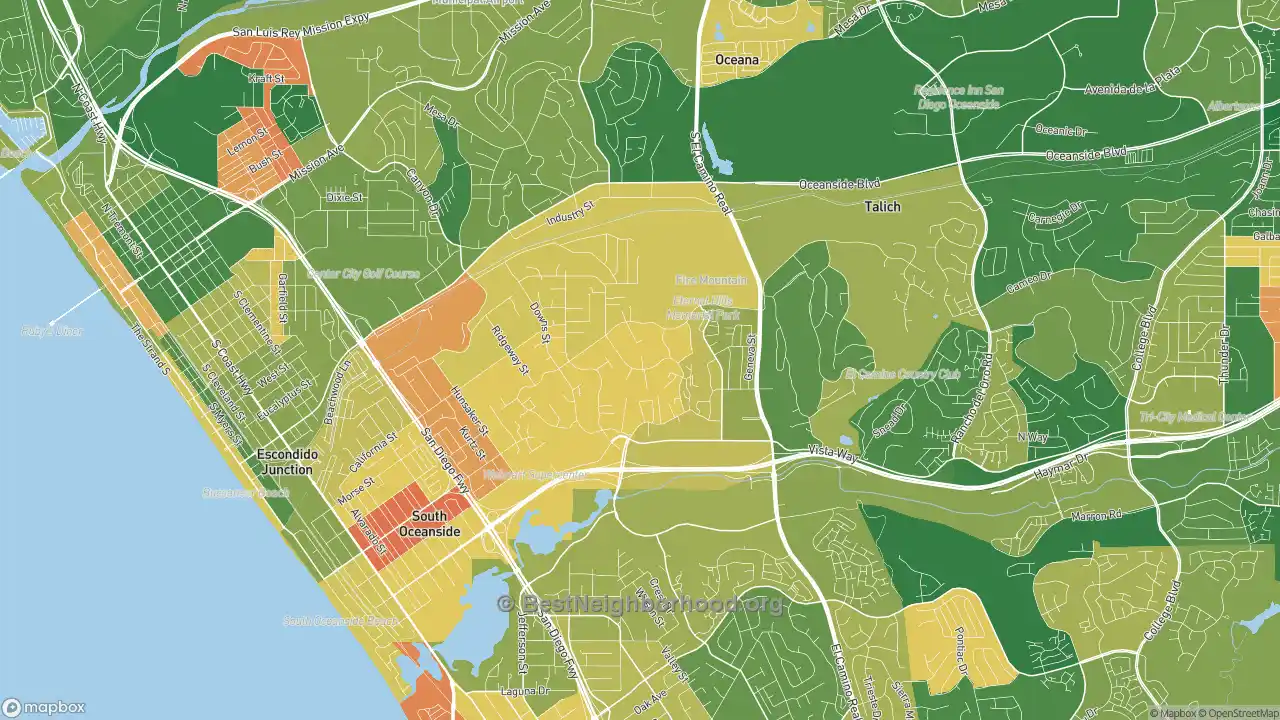
The map below shows diversity in Fire Mountain. Areas in green are more diverse, while areas in red are much less diverse. Diversity, in this case, means a mixture of people with different race and ethnicity living close to one another. For example, all-black and all-white areas in the neighborhood would both be considered lacking diversity.
More diverse
Less diverse
Colorblind friendly
off
Fire Mountain Diversity Score
28
With a diversity score of 28 out of 100, Fire Mountain is less diverse than other US neighborhoods. The most diverse area within Fire Mountain's proper boundaries is to the northeast of the neighborhood. The least diverse areas are located in the southwest parts of Fire Mountain.
Data Sources: U.S. Census, proprietary data mapping and analysis. Special thanks to the University of Virginia.
Nearby Neighborhoods
- South Oceanside, Oceanside, CA: less diverse
- Downtown Carlsbad, Carlsbad, CA: more diverse
- Townsite, Oceanside, CA: more diverse
- Ivey Ranch-Rancho del Oro, Oceanside, CA: more diverse
- East Side Capistrano, Oceanside, CA: more diverse
- San Luis Rey, Oceanside, CA: more diverse
- Lake, Oceanside, CA: more diverse
- Peacock, Oceanside, CA: more diverse
- North Valley San Diego, Oceanside, CA: more diverse
- Guajome, Oceanside, CA: more diverse
Neighborhoods with Similar Populations
- Altamont, Mountain House, CA: more diverse
- Old Town Florissant, Florissant, MO: more diverse
- Millview East, San Marcos, TX: more diverse
- Granville, Prescott Valley, AZ: less diverse
- Brooklands Park, Rochester Hills, MI: more diverse
- Echo Highlands, Birmingham, AL: less diverse
- White Grove, Fort Mill, SC: more diverse
- West Mt. Scott, Happy Valley, OR: more diverse
- Wellington, Manassas, VA: more diverse
- Accent, Des Moines, IA: less diverse