The map below shows majority race by area in Harney County, as self-identified on the US census. Darker shades indicate a larger racial majority in that neighborhood. This page also contains data and maps on Harney County racial diversity and diversity scores. Click here to scroll to diversity data.

WhiteHispanicBlackAsianMultiple/Other
Majority race by area
The majority race in Harney County overall is white, making up 85.5% of residents. The next most-common racial group is hispanic at 6.2%. There are more white people in the south areas of the county. People who identify as hispanic are most likely to be living in the south places. The data below shows how many people identify themselves as each of the following races, which most Americans base on their family's national origin:
Race in Harney County
Self-Identified Race |
Harney County, OR Population |
|---|---|
White |
85.5% |
Hispanic |
6.2% |
Black |
1.1% |
Asian |
0.0% |
Native American |
1.0% |
Other |
6.1% |
Diversity and Diversity Scores for Harney County, OR
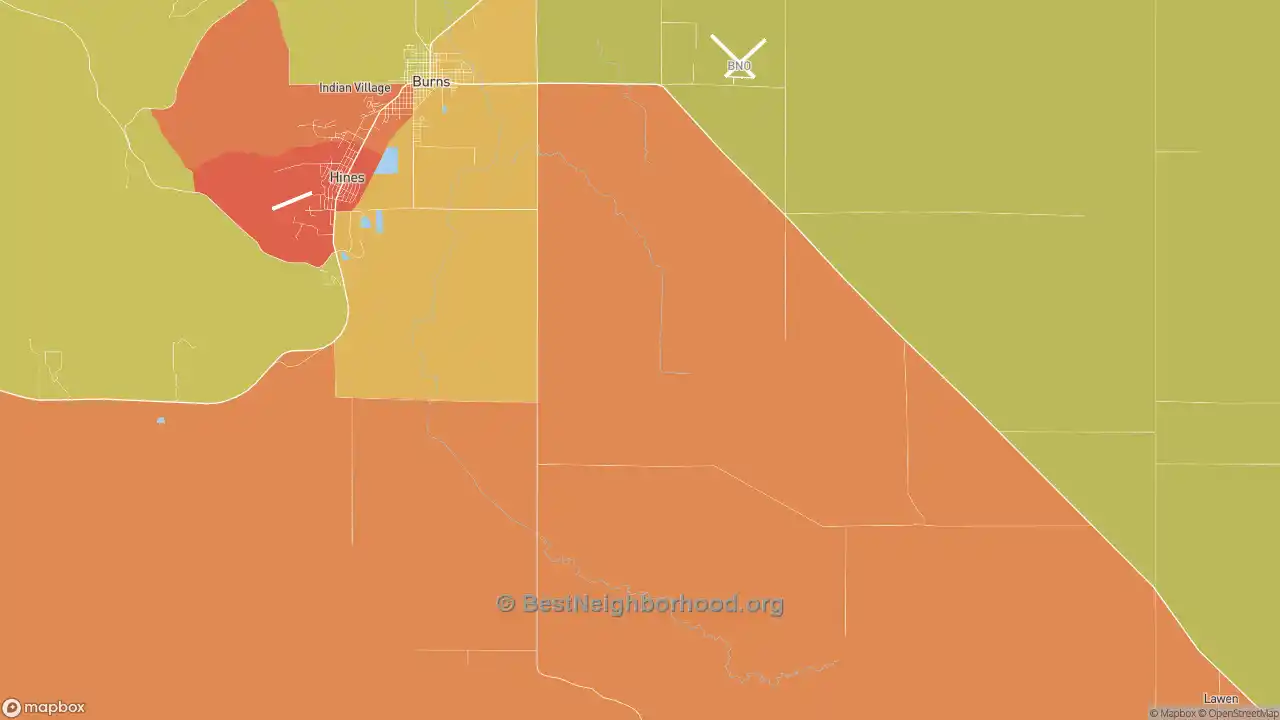
The map below shows diversity in Harney County. Areas in green are more diverse, while areas in red are much less diverse. Diversity, in this case, means a mixture of people with different race and ethnicity living close to one another. For example, all-black and all-white areas in the county would both be considered lacking diversity.
More diverse
Less diverse
Colorblind friendly
off
Harney County Diversity Score
54
With a diversity score of 54 out of 100, Harney County is about average for diversity versus other US counties. The most diverse area within Harney County's proper boundaries is to the northeast of the county. The least diverse areas are located in the south parts of Harney County.
Data Sources: U.S. Census, proprietary data mapping and analysis. Special thanks to the University of Virginia.
Nearby Counties
- Canyon County, ID: more diverse
- Ada County, ID: less diverse
- Blaine County, ID: less diverse
- Butte County, ID: less diverse
- Bonneville County, ID: less diverse
- Jefferson County, ID: less diverse
- Teton County, ID: less diverse
- Teton County, WY: less diverse
- Hot Springs County, WY: less diverse
- Jackson County, SD: more diverse
Counties with Similar Populations
- Atoka County, OK: more diverse
- York County, NE: less diverse
- Appanoose County, IA: less diverse
- Appomattox County, VA: more diverse
- West Feliciana Parish, LA: more diverse
- Wayne County, TN: less diverse
- Arkansas County, AR: more diverse
- Arroyo Municipio, PR: less diverse
- Atchison County, KS: more diverse
- Breathitt County, KY: less diverse