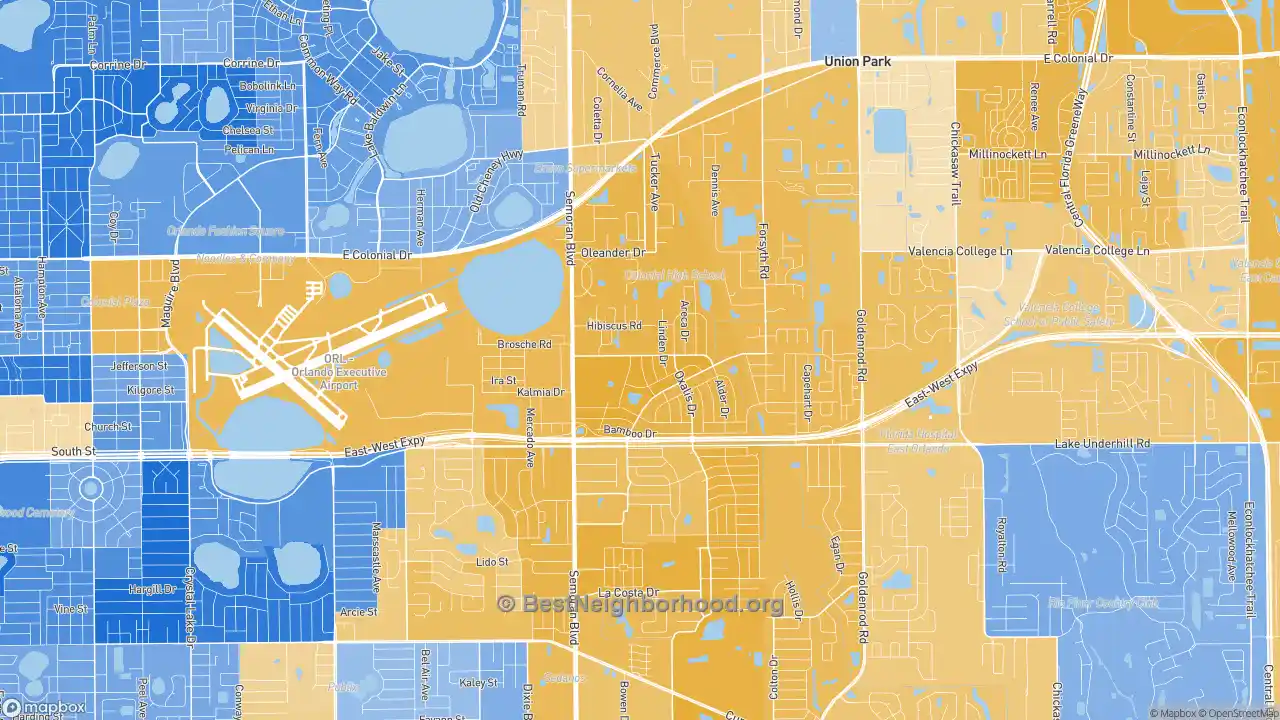
The map below shows majority race by area in Hibiscus, as self-identified on the US census. Darker shades indicate a larger racial majority in that neighborhood. This page also contains data and maps on Hibiscus racial diversity and diversity scores. Click here to scroll to diversity data.
WhiteHispanicBlackAsianMultiple/Other
Majority race by area
The majority race in Hibiscus overall is hispanic, making up 70.5% of residents. The next most-common racial group is white at 20.7%. There are more hispanic people in the central areas of the neighborhood. People who identify as white are most likely to be living in the northwest places. The data below shows how many people identify themselves as each of the following races, which most Americans base on their family's national origin:
Race in Hibiscus
Self-Identified Race |
Hibiscus, Azalea Park, FL Population |
|---|---|
White |
20.7% |
Hispanic |
70.5% |
Black |
3.9% |
Asian |
3.9% |
Native American |
0.0% |
Other |
1.0% |
Diversity and Diversity Scores for Hibiscus, Azalea Park, FL
The map below shows diversity in Hibiscus. Areas in green are more diverse, while areas in red are much less diverse. Diversity, in this case, means a mixture of people with different race and ethnicity living close to one another. For example, all-black and all-white areas in the neighborhood would both be considered lacking diversity.

More diverse
Less diverse
Colorblind friendly
off
Hibiscus Diversity Score
37
With a diversity score of 37 out of 100, Hibiscus is less diverse than other US neighborhoods. The most diverse area within Hibiscus's proper boundaries is to the north of the neighborhood. The least diverse areas are located in the central parts of Hibiscus.
Data Sources: U.S. Census, proprietary data mapping and analysis. Special thanks to the University of Virginia.
Nearby Neighborhoods
- Englewood Park, Orlando, FL: more diverse
- Woodlands-Orlando, Orlando, FL: more diverse
- Baldwin Park, Orlando, FL: more diverse
- Lake Frederica, Orlando, FL: more diverse
- Ventura, Orlando, FL: less diverse
- Mariners Village, Orlando, FL: more diverse
- South Semoran, Orlando, FL: more diverse
- Colonicaltown North, Orlando, FL: less diverse
- Conway, Orlando, FL: more diverse
- Wadeview Park, Orlando, FL: more diverse
Neighborhoods with Similar Populations
- Meredith Parkwood, Santa Ana, CA: more diverse
- Embrey Mill, Stafford, VA: more diverse
- West Cloverdale, Boise, ID: less diverse
- Spring Glen, Hamden, CT: less diverse
- South Ruffner, Charleston, WV: more diverse
- The Gardens, Ocean City, NJ: less diverse
- Villas at Norcross, Norcross, GA: more diverse
- Rancho Fontana, Fontana, CA: more diverse
- Ward Parkway, Kansas City, MO: less diverse
- Perry South, Pittsburgh, PA: less diverse