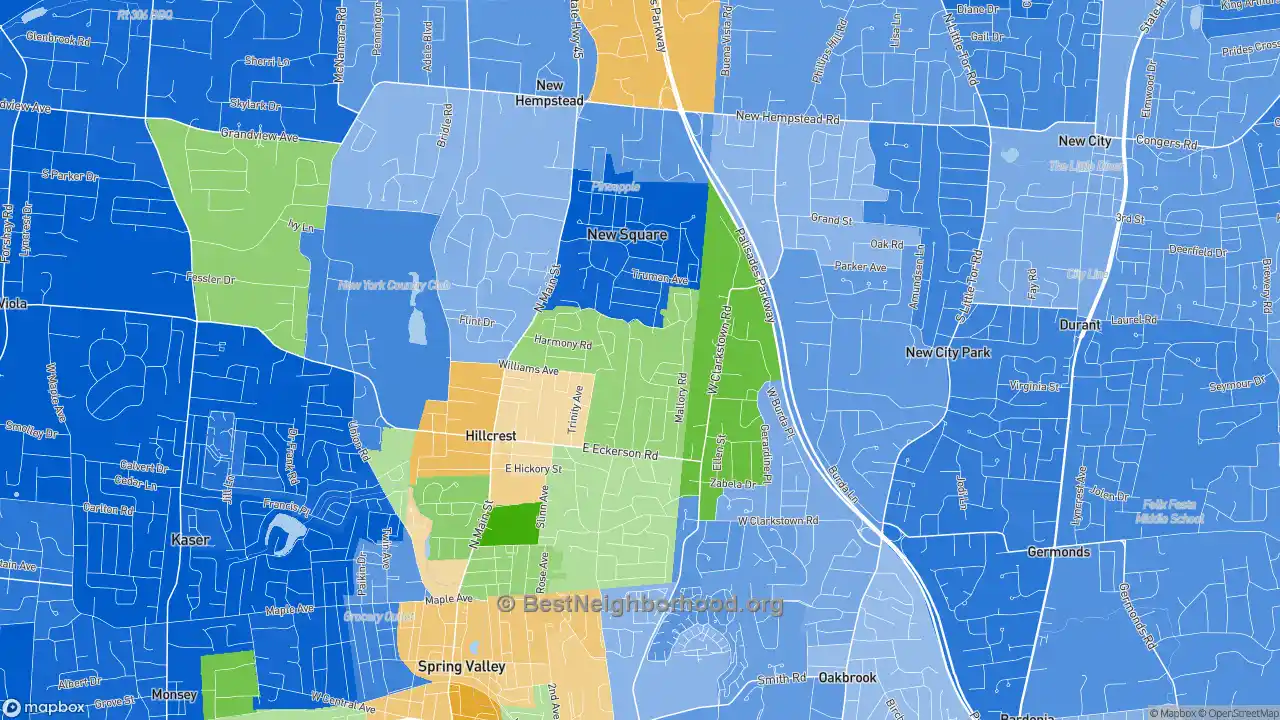
The map below shows majority race by area in Hillcrest, as self-identified on the US census. Darker shades indicate a larger racial majority in that neighborhood. This page also contains data and maps on Hillcrest racial diversity and diversity scores. Click here to scroll to diversity data.
WhiteHispanicBlackAsianMultiple/Other
Majority race by area
The majority race in Hillcrest overall is white, making up 42.4% of residents. The next most-common racial group is black at 35.7%. There are more white people in the north areas of the neighborhood. People who identify as black are most likely to be living in the east places. The data below shows how many people identify themselves as each of the following races, which most Americans base on their family's national origin:
Race in Hillcrest
Self-Identified Race |
Hillcrest, Spring Valley, NY Population |
|---|---|
White |
42.4% |
Hispanic |
14.9% |
Black |
35.7% |
Asian |
5.9% |
Native American |
0.1% |
Other |
1.1% |
Diversity and Diversity Scores for Hillcrest, Spring Valley, NY
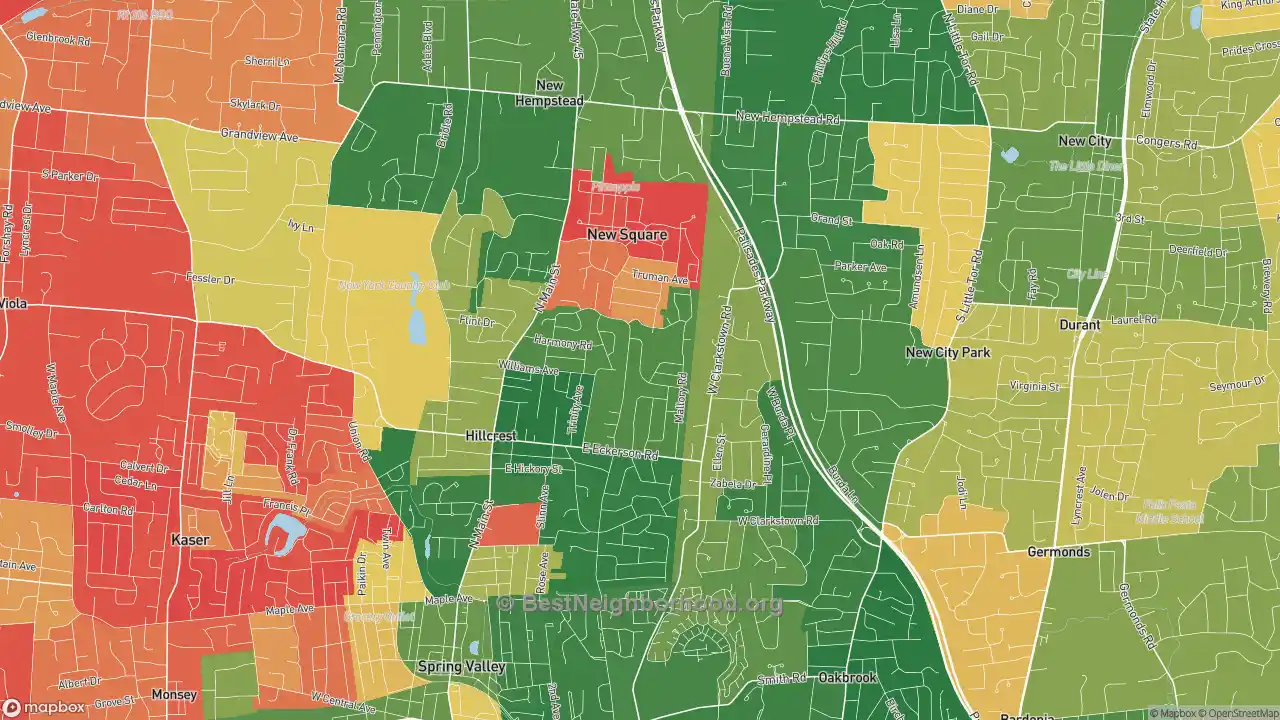
The map below shows diversity in Hillcrest. Areas in green are more diverse, while areas in red are much less diverse. Diversity, in this case, means a mixture of people with different race and ethnicity living close to one another. For example, all-black and all-white areas in the neighborhood would both be considered lacking diversity.
More diverse
Less diverse
Colorblind friendly
off
Hillcrest Diversity Score
50
With a diversity score of 50 out of 100, Hillcrest is about average for diversity versus other US neighborhoods. The most diverse area within Hillcrest's proper boundaries is to the south of the neighborhood. The least diverse areas are located in the north parts of Hillcrest.
Data Sources: U.S. Census, proprietary data mapping and analysis. Special thanks to the University of Virginia.
Nearby Neighborhoods
- Bardonia, West Nyack, NY: more diverse
- Viola, Monsey, NY: less diverse
- Mt Ivy, Pomona, NY: more diverse
- Masonicus, Mahwah, NJ: less diverse
- Northwest Ridgewood, Ridgewood, NJ: less diverse
- Wortendyke, Midland Park, NJ: less diverse
- Downtown Ridgewood, Ridgewood, NJ: less diverse
- Southeast Ridgewood, Ridgewood, NJ: less diverse
- Ridgewood Junction, Glen Rock, NJ: less diverse
- Radburn, Fair Lawn, NJ: less diverse
Neighborhoods with Similar Populations
- Top Road, Trenton, NJ: more diverse
- Denver Harbor-Port Houston, Houston, TX: less diverse
- West Side, Augusta, GA: more diverse
- West Riverside, New Orleans, LA: less diverse
- Downtown South San Francisco, South San Francisco, CA: less diverse
- East Shore, East Haven, CT: less diverse
- Eastwood, Dundalk, MD: more diverse
- West Market Square Historic District, Bangor, ME: less diverse
- Fairground, Des Moines, IA: less diverse
- Far Northeast-Huffman, Huffman, TX: less diverse