The map below shows majority race by area in Italian Village, as self-identified on the US census. Darker shades indicate a larger racial majority in that neighborhood. This page also contains data and maps on Italian Village racial diversity and diversity scores. Click here to scroll to diversity data.

WhiteHispanicBlackAsianMultiple/Other
Majority race by area
The majority race in Italian Village overall is hispanic, making up 55.2% of residents. The next most-common racial group is white at 34.3%. There are more hispanic people in the south areas of the neighborhood. People who identify as white are most likely to be living in the northwest places. The data below shows how many people identify themselves as each of the following races, which most Americans base on their family's national origin:
Race in Italian Village
Self-Identified Race |
Italian Village, Coral Gables, FL Population |
|---|---|
White |
34.3% |
Hispanic |
55.2% |
Black |
3.3% |
Asian |
3.0% |
Native American |
0.0% |
Other |
4.1% |
Diversity and Diversity Scores for Italian Village, Coral Gables, FL
The map below shows diversity in Italian Village. Areas in green are more diverse, while areas in red are much less diverse. Diversity, in this case, means a mixture of people with different race and ethnicity living close to one another. For example, all-black and all-white areas in the neighborhood would both be considered lacking diversity.
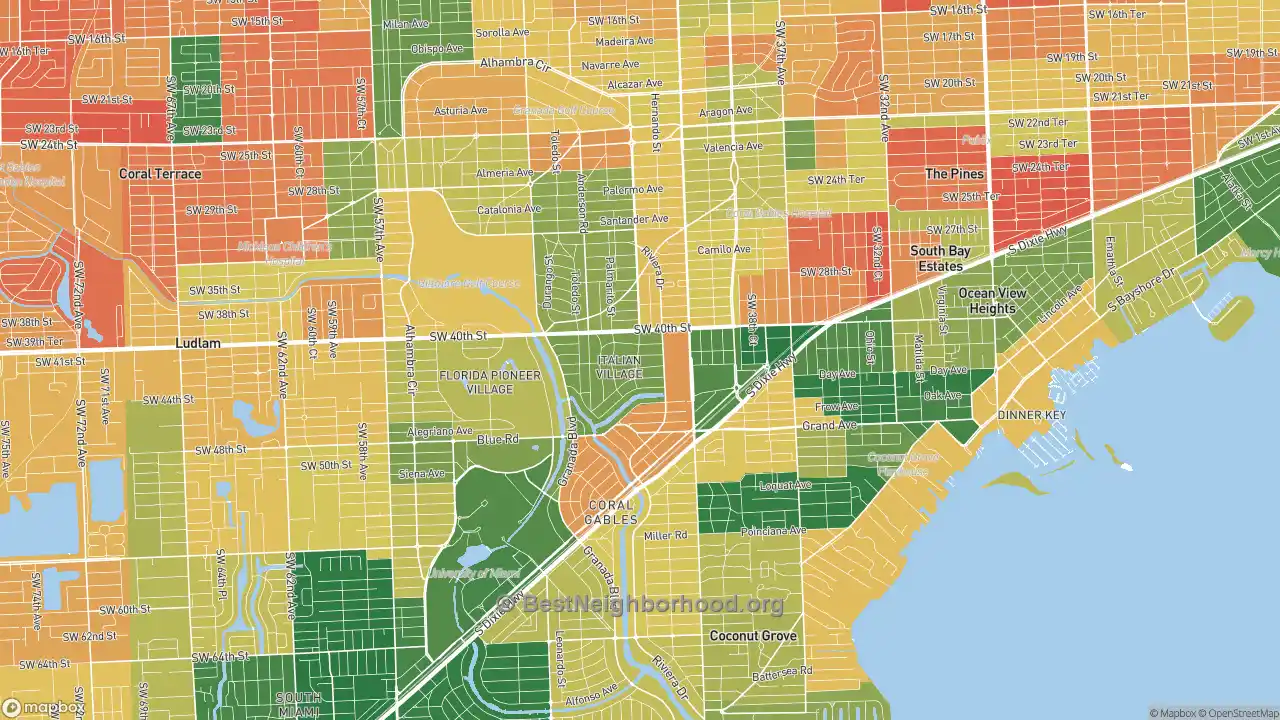
More diverse
Less diverse
Colorblind friendly
off
Italian Village Diversity Score
45
With a diversity score of 45 out of 100, Italian Village is about average for diversity versus other US neighborhoods. The most diverse area within Italian Village's proper boundaries is to the central of the neighborhood. The least diverse areas are located in the northeast parts of Italian Village.
Data Sources: U.S. Census, proprietary data mapping and analysis. Special thanks to the University of Virginia.
Nearby Neighborhoods
- South Coconut Grove, Miami, FL: more diverse
- Riviera, Coral Gables, FL: more diverse
- North Coconut Grove, Miami, FL: more diverse
- West Flagler, Miami, FL: less diverse
- Coral Way, Miami, FL: less diverse
- Flagami, Miami, FL: less diverse
- Little Havana, Miami, FL: less diverse
- Allapattah, Miami, FL: less diverse
- Overtown, Miami, FL: less diverse
- Downtown Miami, Miami, FL: more diverse
Neighborhoods with Similar Populations
- Greens of McKinney, McKinney, TX: more diverse
- Second Creek, Mobile, AL: more diverse
- Santa Clara Heights, Santa Clara, UT: less diverse
- Royal Ridge, San Antonio, TX: more diverse
- River Park, Sacramento, CA: less diverse
- Quail Hollow, Charlotte, NC: less diverse
- Midvale Heights, Madison, WI: less diverse
- Mesa Forest, Austin, TX: less diverse
- McClure Park, Tulsa, OK: more diverse
- Hopkins Fitch Grant, Holly Hill, FL: less diverse