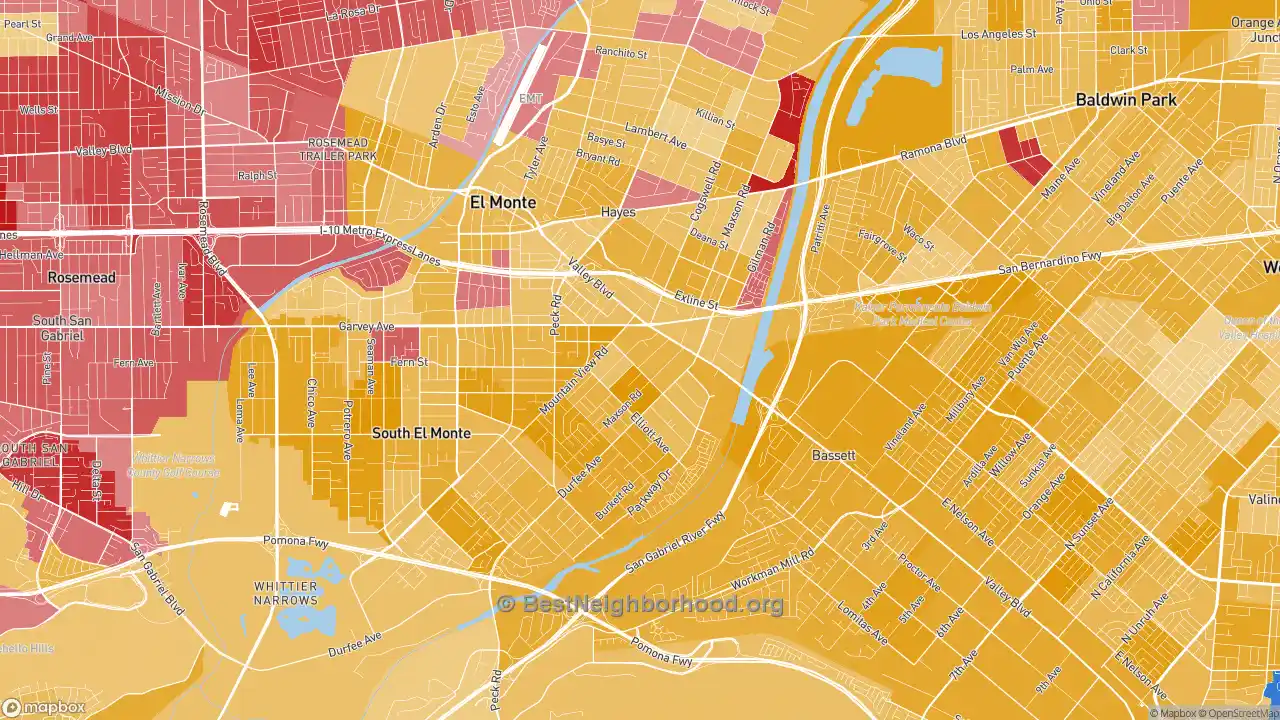
The map below shows majority race by area in Mountain View, as self-identified on the US census. Darker shades indicate a larger racial majority in that neighborhood. This page also contains data and maps on Mountain View racial diversity and diversity scores. Click here to scroll to diversity data.
WhiteHispanicBlackAsianMultiple/Other
Majority race by area
The majority race in Mountain View overall is hispanic, making up 69.2% of residents. The next most-common racial group is asian at 26.9%. There are more hispanic people in the south areas of the neighborhood. People who identify as asian are most likely to be living in the northeast places. The data below shows how many people identify themselves as each of the following races, which most Americans base on their family's national origin:
Race in Mountain View
Self-Identified Race |
Mountain View, El Monte, CA Population |
|---|---|
White |
2.4% |
Hispanic |
69.2% |
Black |
0.3% |
Asian |
26.9% |
Native American |
0.6% |
Other |
0.6% |
Diversity and Diversity Scores for Mountain View, El Monte, CA
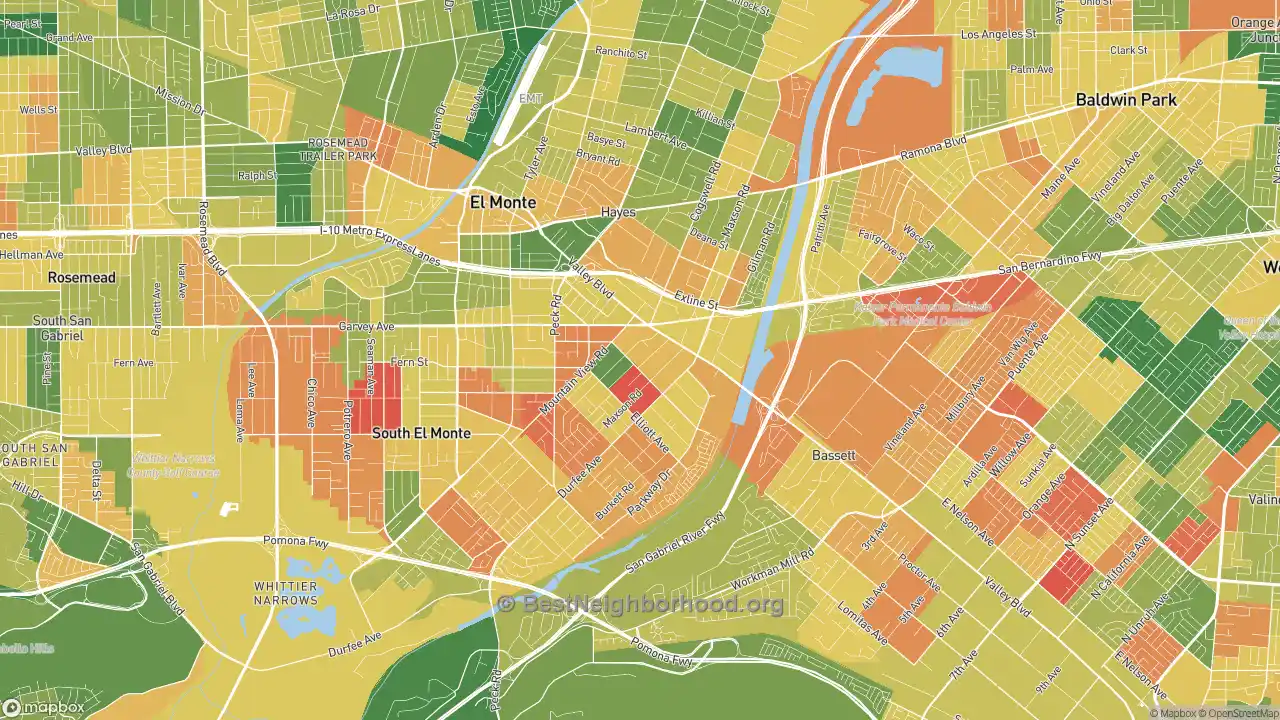
The map below shows diversity in Mountain View. Areas in green are more diverse, while areas in red are much less diverse. Diversity, in this case, means a mixture of people with different race and ethnicity living close to one another. For example, all-black and all-white areas in the neighborhood would both be considered lacking diversity.
More diverse
Less diverse
Colorblind friendly
off
Mountain View Diversity Score
21
With a diversity score of 21 out of 100, Mountain View is less diverse than other US neighborhoods. The most diverse area within Mountain View's proper boundaries is to the northeast of the neighborhood. The least diverse areas are located in the east parts of Mountain View.
Data Sources: U.S. Census, proprietary data mapping and analysis. Special thanks to the University of Virginia.
Nearby Neighborhoods
- Valle Lindo, South El Monte, CA: more diverse
- Bassett, West Puente Valley, CA: less diverse
- North El Monte, Arcadia, CA: more diverse
- South San Gabriel, Rosemead, CA: more diverse
- Mayflower Village, Arcadia, CA: more diverse
- Garvey, Rosemead, CA: more diverse
- East San Gabriel, San Gabriel, CA: more diverse
- El Rancho, Pico Rivera, CA: less diverse
- Los Neitos, West Whittier-Los Nietos, CA: less diverse
- Covina-Valley, Covina, CA: more diverse
Neighborhoods with Similar Populations
- Flour Bluff, Corpus Christi, TX: more diverse
- Fort Bend Houston, Missouri City, TX: more diverse
- Brightwood, Washington, DC: more diverse
- Downtown Stamford, Stamford, CT: more diverse
- Central Arlington, Arlington, TX: more diverse
- Diamond Head-Kapahulu-St Louis, Honolulu, HI: more diverse
- Oneco, Bradenton, FL: more diverse
- Santa Clara, Eugene, OR: more diverse
- San Luis Rey, Oceanside, CA: more diverse
- Rosedale, Bakersfield, CA: more diverse