The map below shows majority race by area in North Torrance, as self-identified on the US census. Darker shades indicate a larger racial majority in that neighborhood. This page also contains data and maps on North Torrance racial diversity and diversity scores. Click here to scroll to diversity data.
WhiteHispanicBlackAsianMultiple/Other
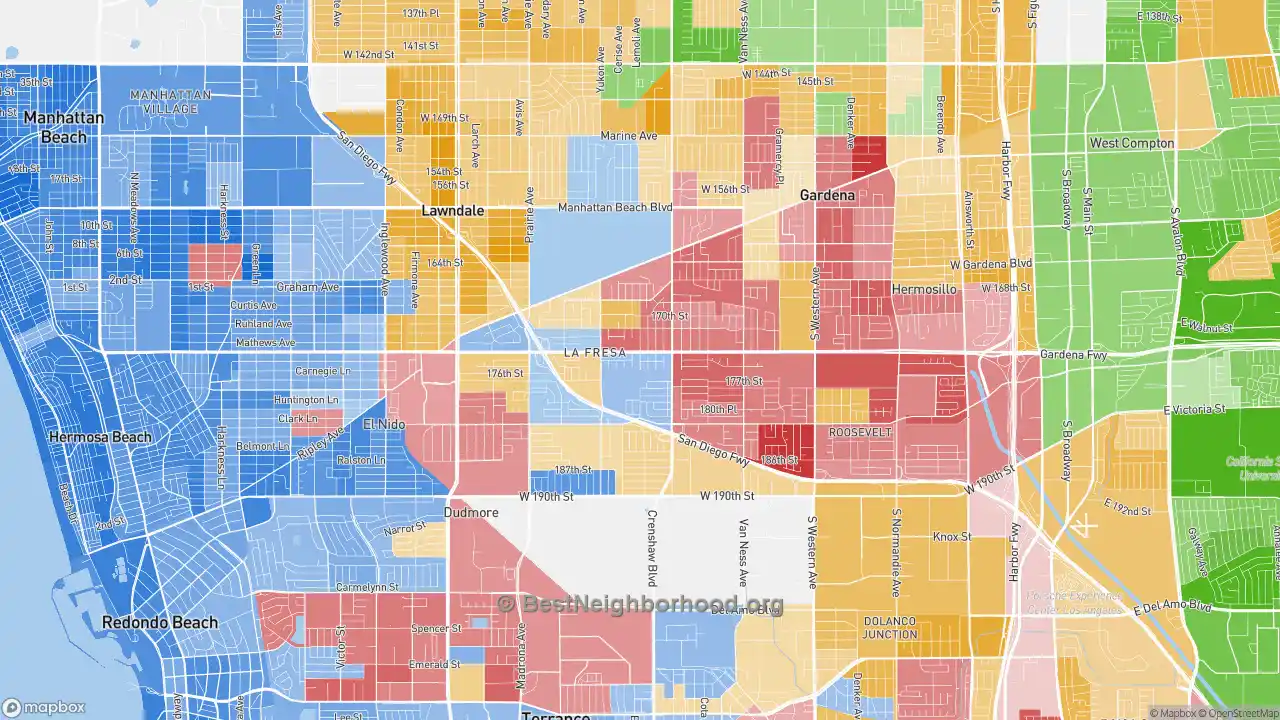
Majority race by area
The majority race in North Torrance overall is asian, making up 38.0% of residents. The next most-common racial group is hispanic at 28.0%. There are more asian people in the southeast areas of the neighborhood. People who identify as hispanic are most likely to be living in the northwest places. The data below shows how many people identify themselves as each of the following races, which most Americans base on their family's national origin:
Race in North Torrance
Self-Identified Race |
North Torrance, Torrance, CA Population |
|---|---|
White |
23.6% |
Hispanic |
28.0% |
Black |
3.6% |
Asian |
38.0% |
Native American |
0.1% |
Other |
6.6% |
Diversity and Diversity Scores for North Torrance, Torrance, CA
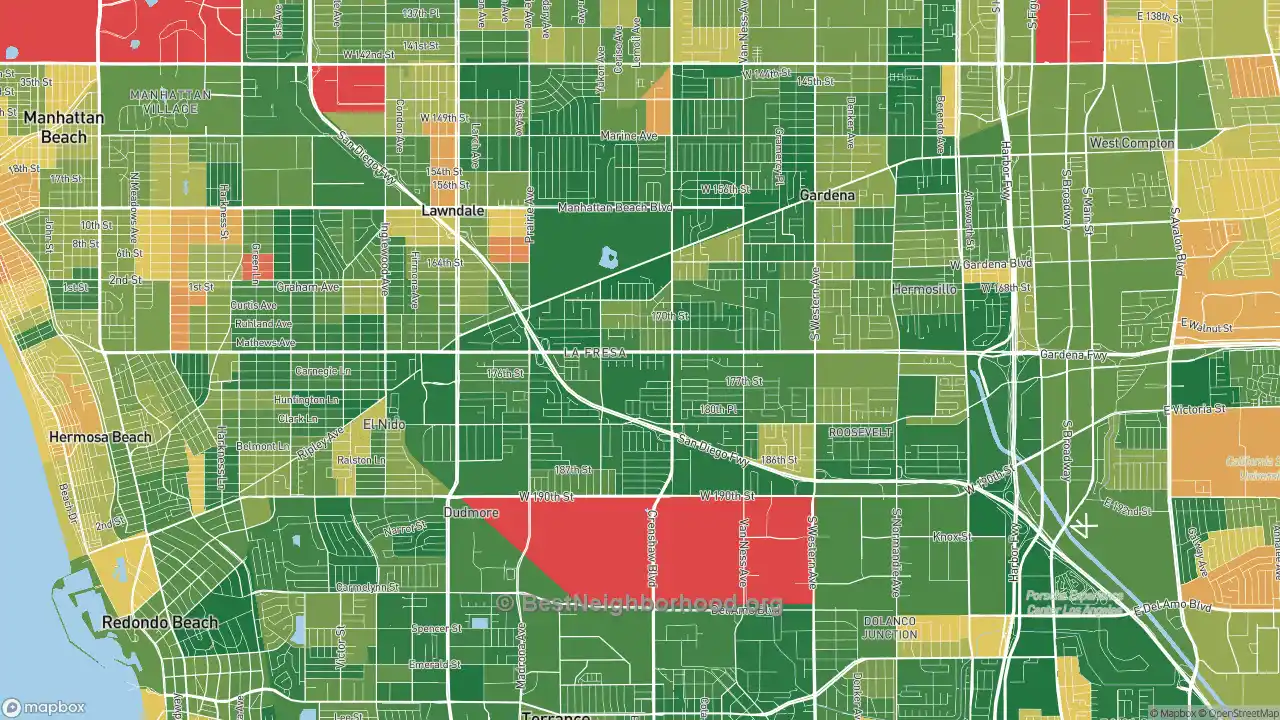
The map below shows diversity in North Torrance. Areas in green are more diverse, while areas in red are much less diverse. Diversity, in this case, means a mixture of people with different race and ethnicity living close to one another. For example, all-black and all-white areas in the neighborhood would both be considered lacking diversity.
More diverse
Less diverse
Colorblind friendly
off
North Torrance Diversity Score
93
With a diversity score of 93 out of 100, North Torrance is much more diverse than other US neighborhoods. The most diverse area within North Torrance's proper boundaries is to the south of the neighborhood. The least diverse areas are located in the southeast parts of North Torrance.
Data Sources: U.S. Census, proprietary data mapping and analysis. Special thanks to the University of Virginia.
Nearby Neighborhoods
- Alondra Park, Lawndale, CA: less diverse
- Harbor Gateway, Torrance, CA: less diverse
- Old Town, Torrance, CA: less diverse
- West Torrance, Torrance, CA: less diverse
- Athens, West Athens, CA: less diverse
- South East Torrance, Torrance, CA: more diverse
- West Rancho Domingues, Compton, CA: less diverse
- Hollywood Riviera, Redondo Beach, CA: less diverse
- Walteria, Torrance, CA: less diverse
- Morningside Park, Inglewood, CA: less diverse
Neighborhoods with Similar Populations
- Wrigley, Long Beach, CA: less diverse
- City Heights East, San Diego, CA: less diverse
- Charter Oak, Covina, CA: less diverse
- Charlotte Gardens, Bronx, NY: less diverse
- Charleston Heights, Las Vegas, NV: less diverse
- Clairemont Mesa, San Diego, CA: less diverse
- Central City, Los Angeles, CA: less diverse
- Carrollwood, Tampa, FL: less diverse
- Carnegie Hill, Manhattan, NY: less diverse
- Wolf Creek, Dallas, TX: less diverse