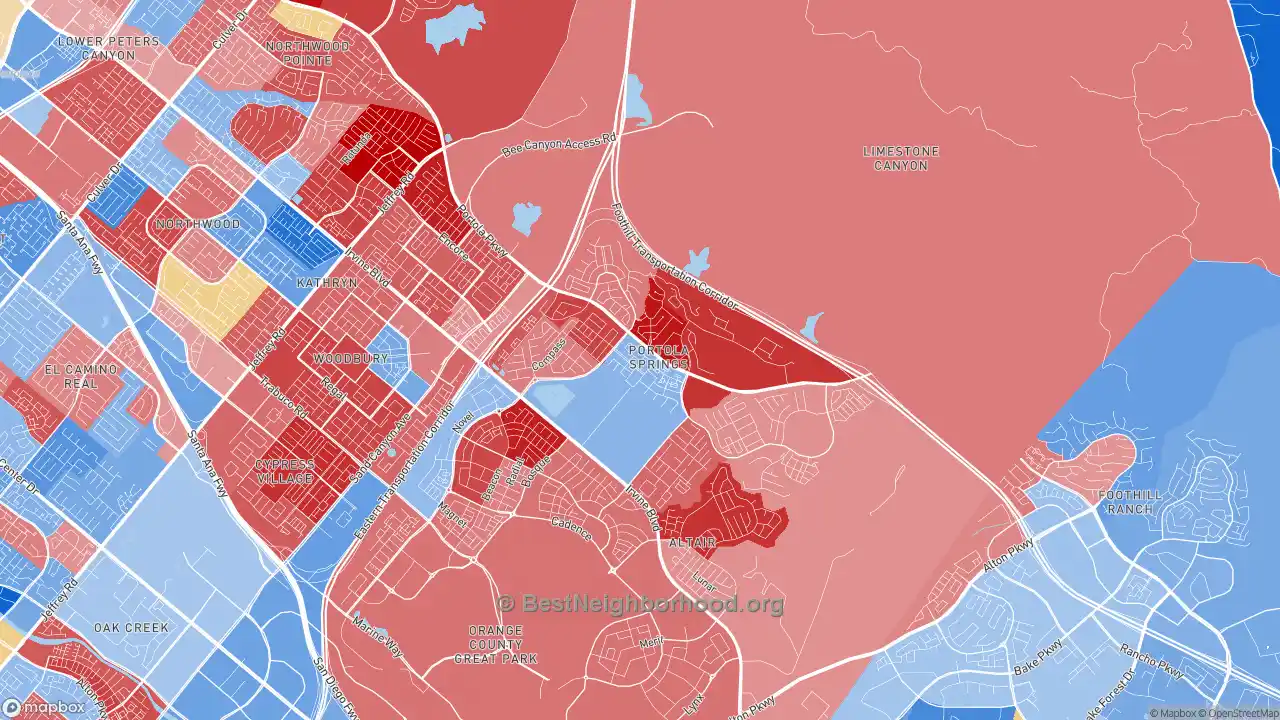
The map below shows majority race by area in Portola Springs, as self-identified on the US census. Darker shades indicate a larger racial majority in that neighborhood. This page also contains data and maps on Portola Springs racial diversity and diversity scores. Click here to scroll to diversity data.
WhiteHispanicBlackAsianMultiple/Other
Majority race by area
The majority race in Portola Springs overall is asian, making up 59.2% of residents. The next most-common racial group is white at 26.4%. There are more asian people in the east areas of the neighborhood. People who identify as white are most likely to be living in the north places. The data below shows how many people identify themselves as each of the following races, which most Americans base on their family's national origin:
Race in Portola Springs
Self-Identified Race |
Portola Springs, Irvine, CA Population |
|---|---|
White |
26.4% |
Hispanic |
7.5% |
Black |
1.1% |
Asian |
59.2% |
Native American |
0.1% |
Other |
5.8% |
Diversity and Diversity Scores for Portola Springs, Irvine, CA
The map below shows diversity in Portola Springs. Areas in green are more diverse, while areas in red are much less diverse. Diversity, in this case, means a mixture of people with different race and ethnicity living close to one another. For example, all-black and all-white areas in the neighborhood would both be considered lacking diversity.

More diverse
Less diverse
Colorblind friendly
off
Portola Springs Diversity Score
54
With a diversity score of 54 out of 100, Portola Springs is about average for diversity versus other US neighborhoods. The most diverse area within Portola Springs's proper boundaries is to the south of the neighborhood. The least diverse areas are located in the southwest parts of Portola Springs.
Data Sources: U.S. Census, proprietary data mapping and analysis. Special thanks to the University of Virginia.
Nearby Neighborhoods
- Orange County Great Park, Irvine, CA: more diverse
- El Toro Marine Air Station, Irvine, CA: more diverse
- Woodbury, Irvine, CA: more diverse
- Spectrum, Irvine, CA: more diverse
- Northwood Point, Irvine, CA: less diverse
- Northwood, Irvine, CA: more diverse
- Irvine Health and Science Complex, Irvine, CA: more diverse
- Orchard Hills, Irvine, CA: less diverse
- El Camino Real, Irvine, CA: more diverse
- Lower Peters Canyon, Irvine, CA: more diverse
Neighborhoods with Similar Populations
- Prospect Lefferts Gardens, Brooklyn, NY: more diverse
- Independence Heights, Houston, TX: less diverse
- LaGrange, Toledo, OH: less diverse
- Asylum Hill, Hartford, CT: more diverse
- Litte Italy, Niagara Falls, NY: more diverse
- Northside, Syracuse, NY: more diverse
- Oakridge, Bakersfield, CA: less diverse
- Old Louisville, Louisville, KY: more diverse
- Prince's Bay, Staten Island, NY: less diverse
- Lakewood Village, Long Beach, CA: more diverse