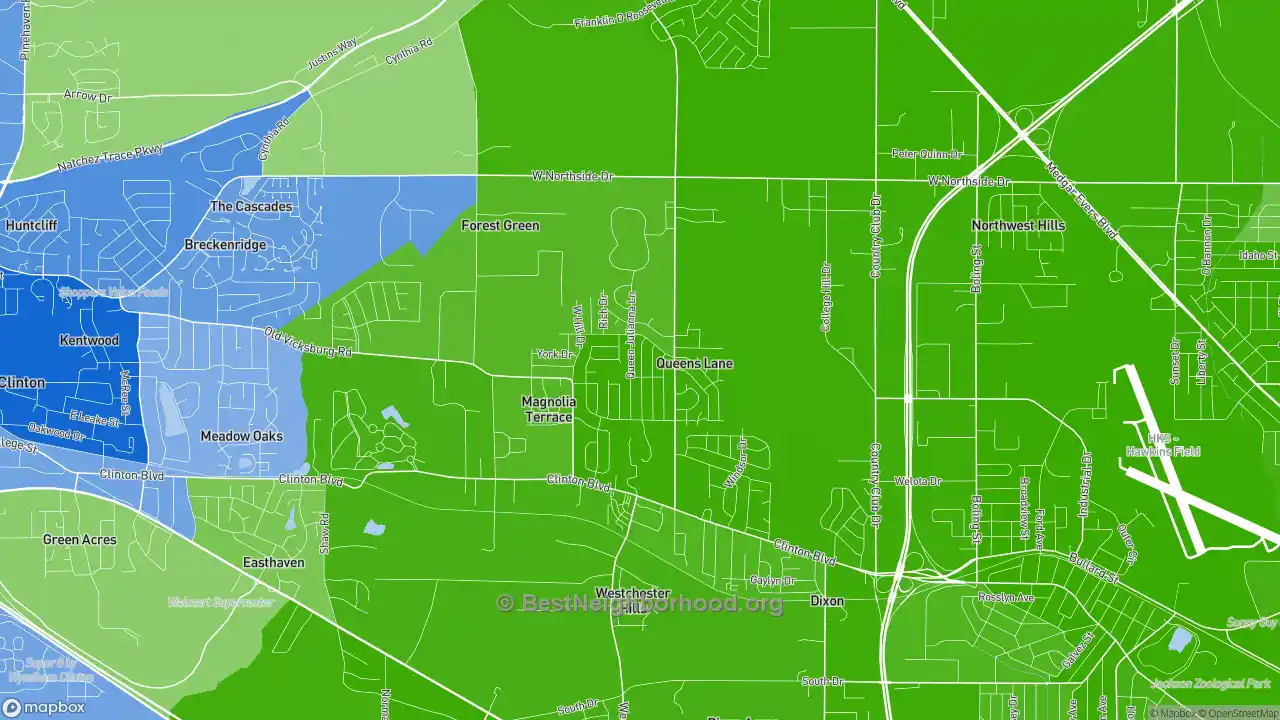
The map below shows majority race by area in Queens-Magnolia Terrace, as self-identified on the US census. Darker shades indicate a larger racial majority in that neighborhood. This page also contains data and maps on Queens-Magnolia Terrace racial diversity and diversity scores. Click here to scroll to diversity data.
WhiteHispanicBlackAsianMultiple/Other
Majority race by area
The majority race in Queens-Magnolia Terrace overall is black, making up 92.2% of residents. The next most-common racial group is white at 7.0%. There are more black people in the central areas of the neighborhood. People who identify as white are most likely to be living in the north places. The data below shows how many people identify themselves as each of the following races, which most Americans base on their family's national origin:
Race in Queens-Magnolia Terrace
Self-Identified Race |
Queens-Magnolia Terrace, Jackson, MS Population |
|---|---|
White |
7.0% |
Hispanic |
0.0% |
Black |
92.2% |
Asian |
0.0% |
Native American |
0.0% |
Other |
0.9% |
Diversity and Diversity Scores for Queens-Magnolia Terrace, Jackson, MS
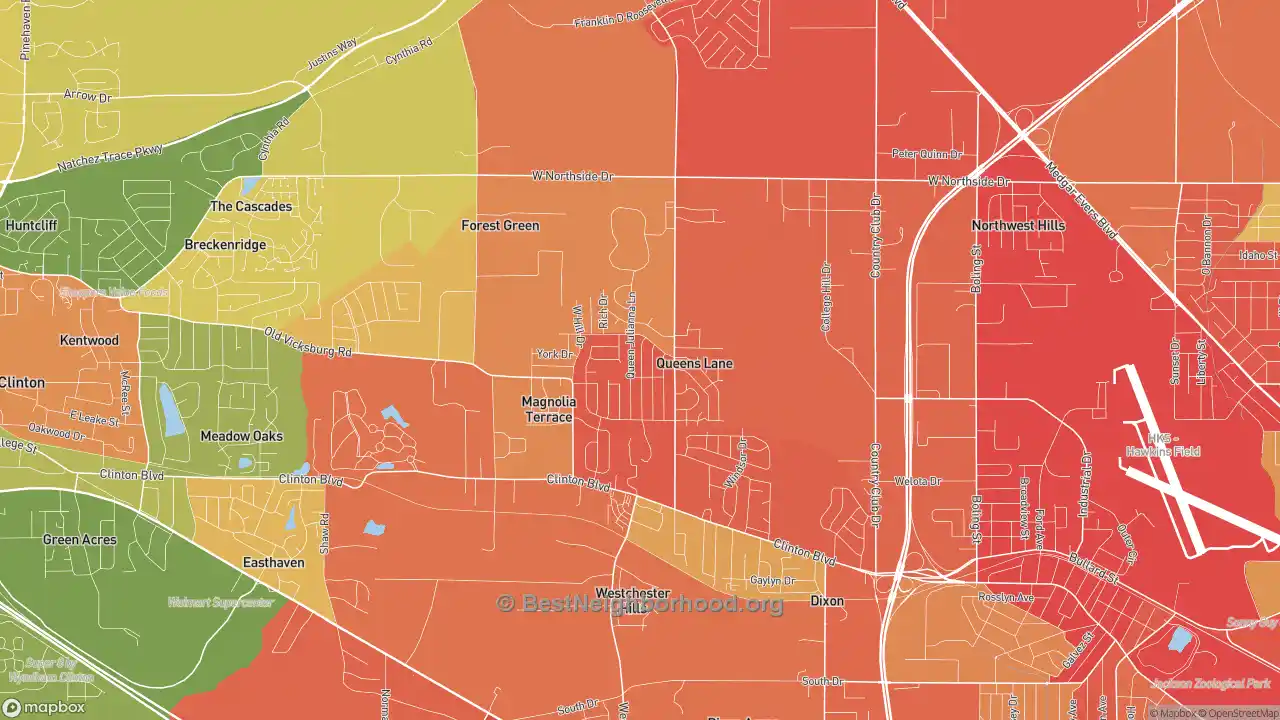
The map below shows diversity in Queens-Magnolia Terrace. Areas in green are more diverse, while areas in red are much less diverse. Diversity, in this case, means a mixture of people with different race and ethnicity living close to one another. For example, all-black and all-white areas in the neighborhood would both be considered lacking diversity.
More diverse
Less diverse
Colorblind friendly
off
Queens-Magnolia Terrace Diversity Score
3
With a diversity score of 3 out of 100, Queens-Magnolia Terrace is much less diverse than other US neighborhoods. The most diverse area within Queens-Magnolia Terrace's proper boundaries is to the north of the neighborhood. The least diverse areas are located in the central parts of Queens-Magnolia Terrace.
Data Sources: U.S. Census, proprietary data mapping and analysis. Special thanks to the University of Virginia.
Nearby Neighborhoods
- West Central Jackson, Jackson, MS: less diverse
- Greater Belhaven, Jackson, MS: more diverse
- Fondren North Renaissance, Jackson, MS: more diverse
- Citizens Southwest, Jackson, MS: more diverse
- Northbrook, Jackson, MS: more diverse
- Broadmoor-Anderson Isle-Shreve Isle, Shreveport, LA: more diverse
- Springlake-University Terrace, Shreveport, LA: more diverse
- Ellerbee Woods, Shreveport, LA: more diverse
- Highland-Stoner Hill, Shreveport, LA: more diverse
- Caddo Heights-South Highlands, Shreveport, LA: more diverse
Neighborhoods with Similar Populations
- Northeast Heights, Wichita, KS: more diverse
- Rogers Park, Fort Collins, CO: more diverse
- Greendale Village, Needham, MA: more diverse
- Waters, Lubbock, TX: more diverse
- Vale and Eastern Avenue, Schenectady, NY: more diverse
- Downtown, Portland, ME: more diverse
- Grafton Hill, Worcester, MA: more diverse
- Plaza-Shamrock, Charlotte, NC: more diverse
- Chatham Parkway, Savannah, GA: more diverse
- Tice, Fort Myers, FL: more diverse