The map below shows majority race by area in Stanton Park, as self-identified on the US census. Darker shades indicate a larger racial majority in that neighborhood. This page also contains data and maps on Stanton Park racial diversity and diversity scores. Click here to scroll to diversity data.

WhiteHispanicBlackAsianMultiple/Other
Majority race by area
The majority race in Stanton Park overall is white, making up 70.7% of residents. The next most-common racial group is black at 13.3%. There are more white people in the west areas of the neighborhood. People who identify as black are most likely to be living in the northeast places. The data below shows how many people identify themselves as each of the following races, which most Americans base on their family's national origin:
Race in Stanton Park
Self-Identified Race |
Stanton Park, Washington, DC Population |
|---|---|
White |
70.7% |
Hispanic |
8.8% |
Black |
13.3% |
Asian |
2.8% |
Native American |
0.1% |
Other |
4.3% |
Diversity and Diversity Scores for Stanton Park, Washington, DC
The map below shows diversity in Stanton Park. Areas in green are more diverse, while areas in red are much less diverse. Diversity, in this case, means a mixture of people with different race and ethnicity living close to one another. For example, all-black and all-white areas in the neighborhood would both be considered lacking diversity.
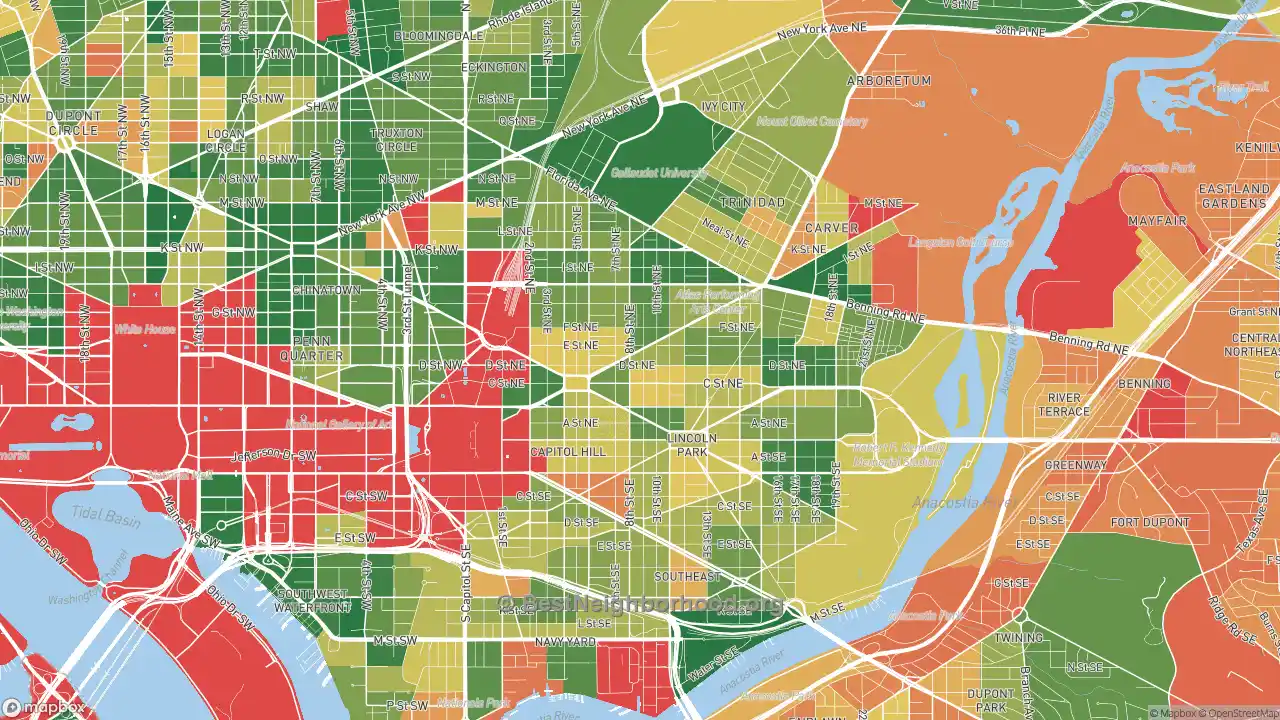
More diverse
Less diverse
Colorblind friendly
off
Stanton Park Diversity Score
48
With a diversity score of 48 out of 100, Stanton Park is about average for diversity versus other US neighborhoods. The most diverse area within Stanton Park's proper boundaries is to the southwest of the neighborhood. The least diverse areas are located in the west parts of Stanton Park.
Data Sources: U.S. Census, proprietary data mapping and analysis. Special thanks to the University of Virginia.
Nearby Neighborhoods
- Capitol Hill, Washington, DC: more diverse
- Lincoln Park, Washington, DC: less diverse
- Stadium-Armory, Washington, DC: more diverse
- Hill East, Washington, DC: more diverse
- Mt Vernon Square, Washington, DC: more diverse
- Brentwood, Washington, DC: more diverse
- Shaw, Washington, DC: more diverse
- Downtown, Washington, DC: more diverse
- South West, Washington, DC: more diverse
- Ledroit Park, Washington, DC: more diverse
Neighborhoods with Similar Populations
- Hillsborough, Raleigh, NC: less diverse
- Spanos Park, Stockton, CA: more diverse
- South Lake Union, Seattle, WA: more diverse
- South End, Burlington, VT: less diverse
- Maplewood, Fall River, MA: less diverse
- Magnolia Center, Riverside, CA: more diverse
- Lowry Park Central, Tampa, FL: more diverse
- Logan Circle, Washington, DC: more diverse
- Lakewood Ranch, Bradenton, FL: less diverse
- Kahaluu, Kaneohe, HI: more diverse