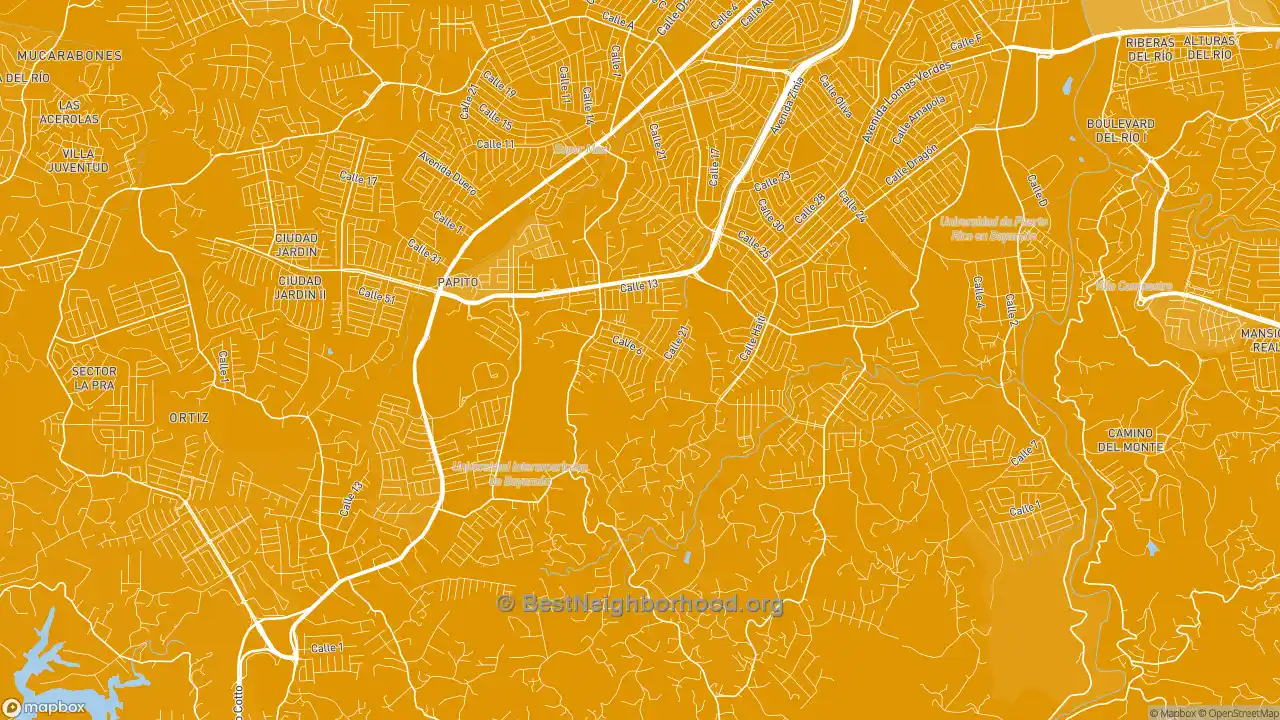
The map below shows majority race by area in Urbanizacion El Cortijo, as self-identified on the US census. Darker shades indicate a larger racial majority in that neighborhood. This page also contains data and maps on Urbanizacion El Cortijo racial diversity and diversity scores. Click here to scroll to diversity data.
WhiteHispanicBlackAsianMultiple/Other
Majority race by area
The majority race in Urbanizacion El Cortijo overall is hispanic, making up 98.8% of residents. The next most-common racial group is other at 0.7%. There are more hispanic people in the central areas of the neighborhood. People who identify as other are most likely to be living in the north places. The data below shows how many people identify themselves as each of the following races, which most Americans base on their family's national origin:
Race in Urbanizacion El Cortijo
Self-Identified Race |
Urbanizacion El Cortijo, Bayamon, PR Population |
|---|---|
White |
0.0% |
Hispanic |
98.8% |
Black |
0.5% |
Asian |
0.0% |
Native American |
0.0% |
Other |
0.7% |
Diversity and Diversity Scores for Urbanizacion El Cortijo, Bayamon, PR
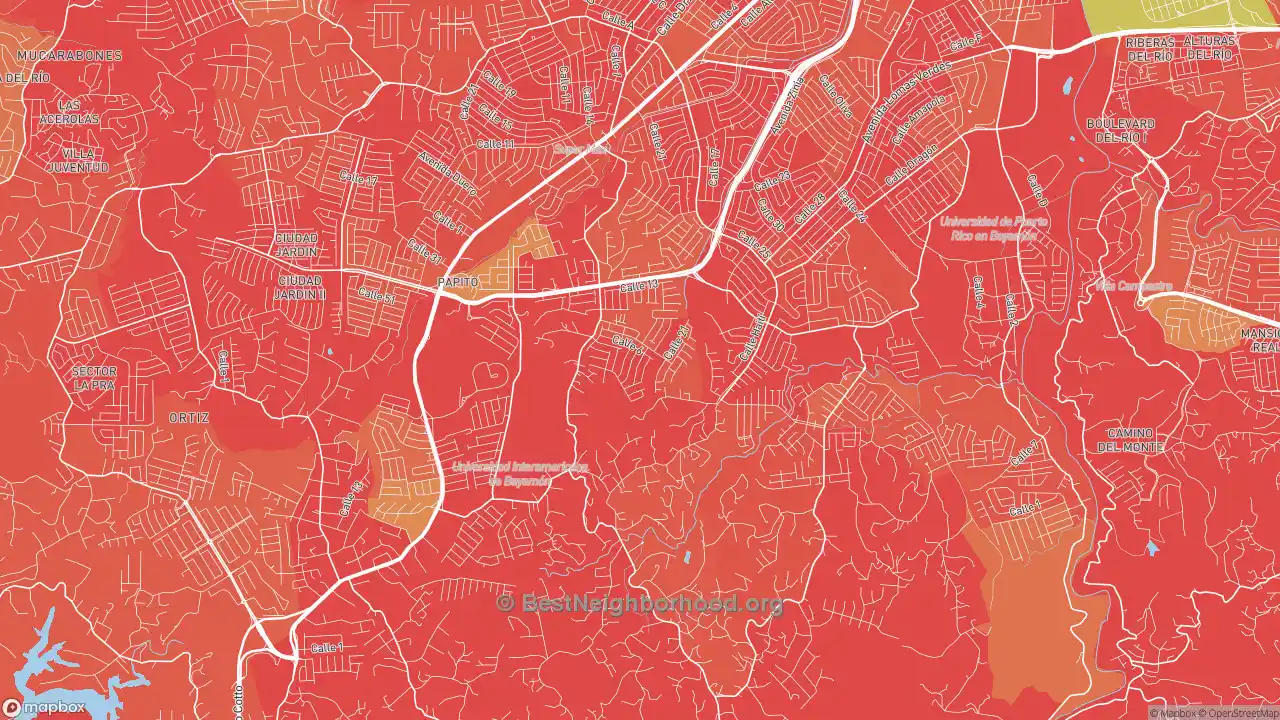
The map below shows diversity in Urbanizacion El Cortijo. Areas in green are more diverse, while areas in red are much less diverse. Diversity, in this case, means a mixture of people with different race and ethnicity living close to one another. For example, all-black and all-white areas in the neighborhood would both be considered lacking diversity.
More diverse
Less diverse
Colorblind friendly
off
Urbanizacion El Cortijo Diversity Score
1
With a diversity score of 1 out of 100, Urbanizacion El Cortijo is much less diverse than other US neighborhoods. The most diverse area within Urbanizacion El Cortijo's proper boundaries is to the north of the neighborhood. The least diverse areas are located in the central parts of Urbanizacion El Cortijo.
Data Sources: U.S. Census, proprietary data mapping and analysis. Special thanks to the University of Virginia.
Nearby Neighborhoods
- Urbanizacion Santa Juanita, Bayamon, PR: less diverse
- Urbanizacion Rexville, Bayamon, PR: less diverse
- Urbanizacion Bayamon Gdns, Bayamon, PR: less diverse
- Urbanizacion Sierra Linda, Bayamon, PR: less diverse
- Lomas Verdes, Bayamon, PR: less diverse
- Parcelas van Scoy, Bayamon, PR: less diverse
- Urbanizacion Miraflores, Bayamon, PR: less diverse
- Urbanizacion Toa Alta Hts, Toa Alta, PR: less diverse
- Urbanizacion Palacios del Rio 2, Bayamon, PR: more diverse
- Urbanizacion Santa Rosa, Bayamon, PR: more diverse
Neighborhoods with Similar Populations
- Berkeley Hills, Emporia, KS: more diverse
- Jungle Terrace, St. Petersburg, FL: more diverse
- Sky Ranch, Santee, CA: more diverse
- Riverside-Everett, Everett, WA: more diverse
- Petersburg, Scranton, PA: more diverse
- South of Fifth, Miami Beach, FL: more diverse
- Olde Orchard, Columbus, OH: more diverse
- Middle River Terrace, Fort Lauderdale, FL: more diverse
- Mesa Junction, Pueblo, CO: more diverse
- Tampa International Airport Area, Tampa, FL: more diverse