The map below shows majority race by area in Villa de Loiza, as self-identified on the US census. Darker shades indicate a larger racial majority in that neighborhood. This page also contains data and maps on Villa de Loiza racial diversity and diversity scores. Click here to scroll to diversity data.

WhiteHispanicBlackAsianMultiple/Other
Majority race by area
The majority race in Villa de Loiza overall is hispanic, making up 99.8% of residents. The next most-common racial group is black at 0.1%. There are more hispanic people in the northwest areas of the neighborhood. People who identify as black are most likely to be living in the east places. The data below shows how many people identify themselves as each of the following races, which most Americans base on their family's national origin:
Race in Villa de Loiza
Self-Identified Race |
Villa de Loiza, Rio Grande, PR Population |
|---|---|
White |
0.1% |
Hispanic |
99.8% |
Black |
0.1% |
Asian |
0.0% |
Native American |
0.0% |
Other |
0.0% |
Diversity and Diversity Scores for Villa de Loiza, Rio Grande, PR
The map below shows diversity in Villa de Loiza. Areas in green are more diverse, while areas in red are much less diverse. Diversity, in this case, means a mixture of people with different race and ethnicity living close to one another. For example, all-black and all-white areas in the neighborhood would both be considered lacking diversity.
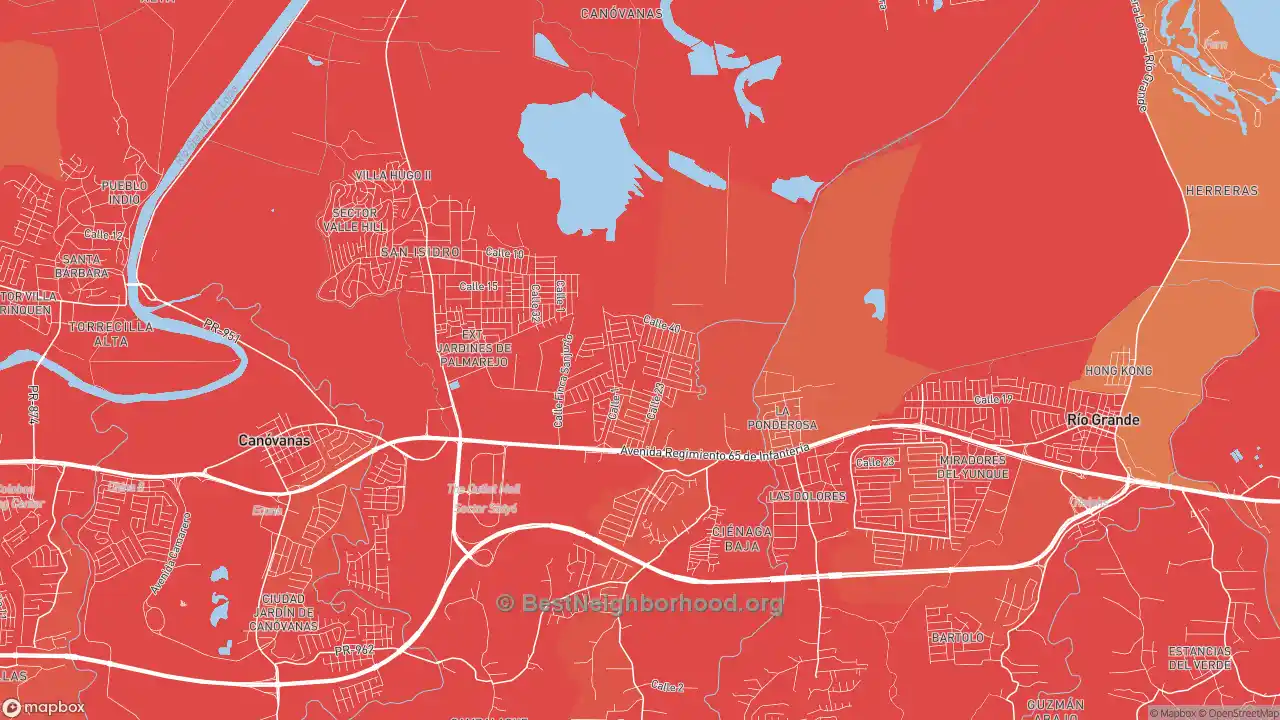
More diverse
Less diverse
Colorblind friendly
off
Villa de Loiza Diversity Score
0
With a diversity score of 0 out of 100, Villa de Loiza is much less diverse than other US neighborhoods. The most diverse area within Villa de Loiza's proper boundaries is to the east of the neighborhood. The least diverse areas are located in the northwest parts of Villa de Loiza.
Data Sources: U.S. Census, proprietary data mapping and analysis. Special thanks to the University of Virginia.
Nearby Neighborhoods
- Alturas de Rio Grande, Rio Grande, PR: more diverse
- Urbanizacion Rio Grande Estates, Rio Grande, PR: less diverse
- Villa Carolina, Carolina, PR: more diverse
- Villa Fontana, Carolina, PR: less diverse
- Valle Arriba Hts, Carolina, PR: more diverse
- Jardines de Country Club, Carolina, PR: more diverse
- Urbanizacion Metropolis, Carolina, PR: more diverse
- Urbanizacion Vistamar, Carolina, PR: less diverse
- Urbanizacion El Comandante, Carolina, PR: more diverse
- Parcelas Saint Just, Trujillo Alto, PR: more diverse
Neighborhoods with Similar Populations
- Arlington Park, Sarasota, FL: more diverse
- Woodstock, Jacksonville, FL: more diverse
- Willamette-West Linn, West Linn, OR: more diverse
- Wildwood, Ann Arbor, MI: more diverse
- Whisman Station, Mountain View, CA: more diverse
- Westhaven, Franklin, TN: more diverse
- West Slope, Beaverton, OR: more diverse
- West Gate, Columbus, OH: more diverse
- Webster, Orono, ME: more diverse
- Waynita-Simonds-Norway Hill, Bothell, WA: more diverse