The map below shows majority race by area in Westfield, as self-identified on the US census. Darker shades indicate a larger racial majority in that neighborhood. This page also contains data and maps on Westfield racial diversity and diversity scores. Click here to scroll to diversity data.
WhiteHispanicBlackAsianMultiple/Other
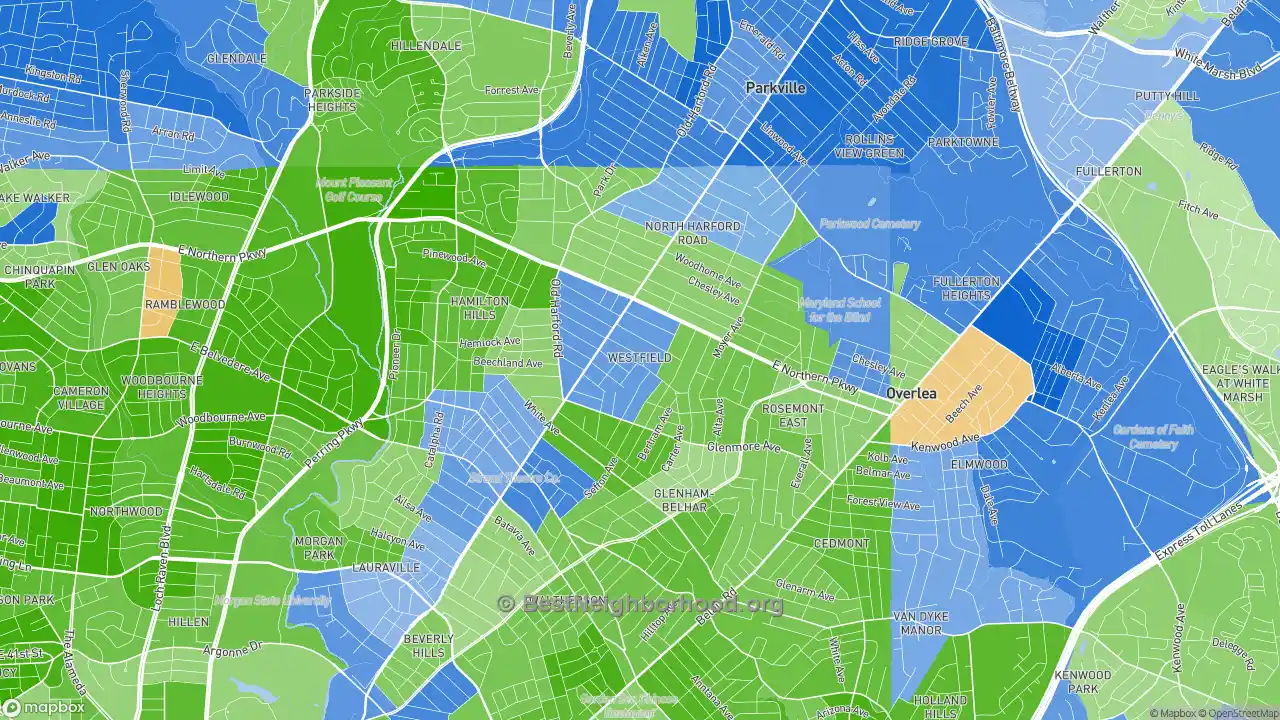
Majority race by area
The majority race in Westfield overall is black, making up 47.2% of residents. The next most-common racial group is white at 43.9%. There are more black people in the southeast areas of the neighborhood. People who identify as white are most likely to be living in the northwest places. The data below shows how many people identify themselves as each of the following races, which most Americans base on their family's national origin:
Race in Westfield
Self-Identified Race |
Westfield, Baltimore, MD Population |
|---|---|
White |
43.9% |
Hispanic |
4.1% |
Black |
47.2% |
Asian |
0.1% |
Native American |
0.1% |
Other |
4.6% |
Diversity and Diversity Scores for Westfield, Baltimore, MD
The map below shows diversity in Westfield. Areas in green are more diverse, while areas in red are much less diverse. Diversity, in this case, means a mixture of people with different race and ethnicity living close to one another. For example, all-black and all-white areas in the neighborhood would both be considered lacking diversity.

More diverse
Less diverse
Colorblind friendly
off
Westfield Diversity Score
40
With a diversity score of 40 out of 100, Westfield is about average for diversity versus other US neighborhoods. The most diverse area within Westfield's proper boundaries is to the northwest of the neighborhood. The least diverse areas are located in the southwest parts of Westfield.
Data Sources: U.S. Census, proprietary data mapping and analysis. Special thanks to the University of Virginia.
Nearby Neighborhoods
- Hamilton Area, Baltimore, MD: less diverse
- North Harford Road, Baltimore, MD: more diverse
- Glenham-Belhar, Baltimore, MD: less diverse
- Villa Cresta, Parkville, MD: less diverse
- Waltherson, Baltimore, MD: less diverse
- Lauraville, Baltimore, MD: more diverse
- Hillendale, Parkville, MD: more diverse
- Upper Northwood, Baltimore, MD: less diverse
- Loch Raven Village, Parkville, MD: less diverse
- Frankford, Baltimore, MD: less diverse
Neighborhoods with Similar Populations
- Essex, Chicago, IL: less diverse
- Haggin Oaks, Bakersfield, CA: more diverse
- The Boulevards, Canton, OH: more diverse
- Starview, Redding, CA: more diverse
- SR Marmon, Albuquerque, NM: more diverse
- Spencer View Terrace, Deer Park, TX: less diverse
- Lakeview Terrace, Kansas City, MO: more diverse
- Kabrich Crescent, Blacksburg, VA: less diverse
- Isle of Palms, Jacksonville Beach, FL: less diverse
- Hillsmere Shores, Annapolis Neck, MD: less diverse