The map below shows majority race by area in Wheaton-Glenmont, as self-identified on the US census. Darker shades indicate a larger racial majority in that neighborhood. This page also contains data and maps on Wheaton-Glenmont racial diversity and diversity scores. Click here to scroll to diversity data.

WhiteHispanicBlackAsianMultiple/Other
Majority race by area
The majority race in Wheaton-Glenmont overall is hispanic, making up 34.4% of residents. The next most-common racial group is white at 26.5%. There are more hispanic people in the central areas of the neighborhood. People who identify as white are most likely to be living in the east places. The data below shows how many people identify themselves as each of the following races, which most Americans base on their family's national origin:
Race in Wheaton-Glenmont
Self-Identified Race |
Wheaton-Glenmont, Wheaton, MD Population |
|---|---|
White |
26.5% |
Hispanic |
34.4% |
Black |
22.3% |
Asian |
12.6% |
Native American |
0.1% |
Other |
4.1% |
Diversity and Diversity Scores for Wheaton-Glenmont, Wheaton, MD
The map below shows diversity in Wheaton-Glenmont. Areas in green are more diverse, while areas in red are much less diverse. Diversity, in this case, means a mixture of people with different race and ethnicity living close to one another. For example, all-black and all-white areas in the neighborhood would both be considered lacking diversity.
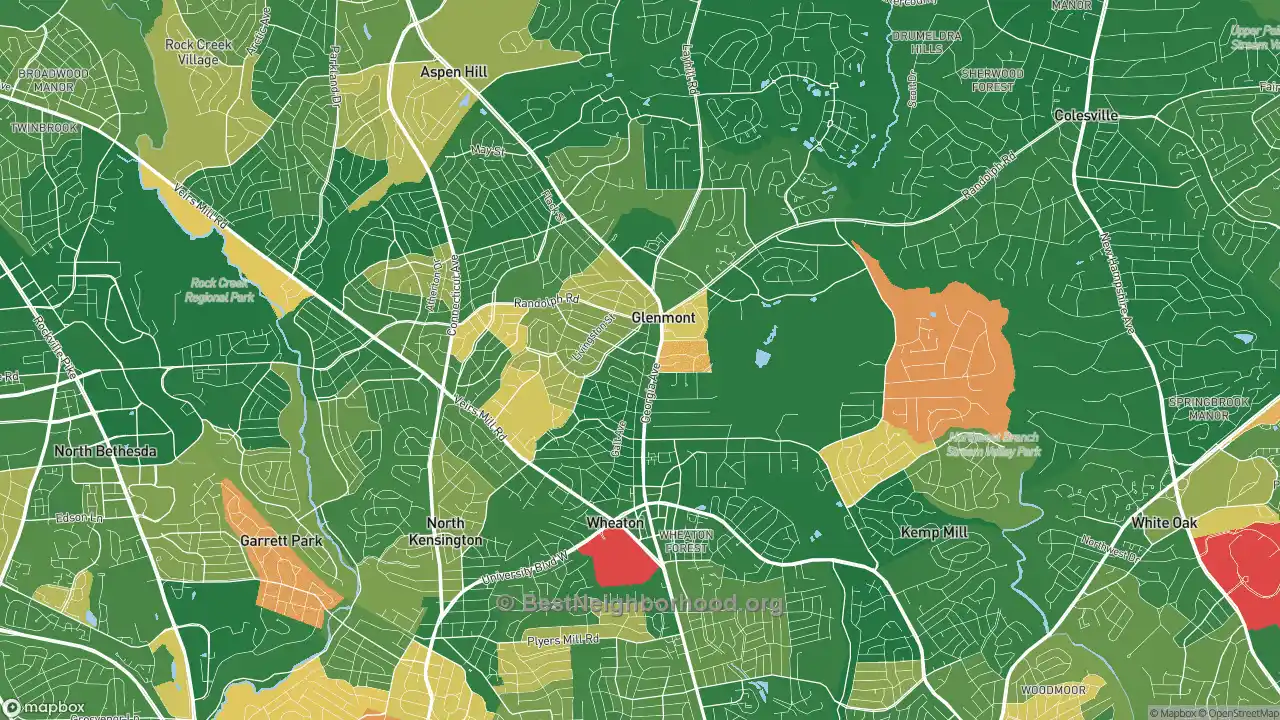
More diverse
Less diverse
Colorblind friendly
off
Wheaton-Glenmont Diversity Score
93
With a diversity score of 93 out of 100, Wheaton-Glenmont is much more diverse than other US neighborhoods. The most diverse area within Wheaton-Glenmont's proper boundaries is to the northeast of the neighborhood. The least diverse areas are located in the east parts of Wheaton-Glenmont.
Data Sources: U.S. Census, proprietary data mapping and analysis. Special thanks to the University of Virginia.
Nearby Neighborhoods
- North Kensington, Kensington, MD: less diverse
- Forest Glen, Silver Spring, MD: less diverse
- Silver Rock, Rockville, MD: less diverse
- Takoma Park, Washington, DC: less diverse
- Hillandale, Silver Spring, MD: less diverse
- Croydon Park, Rockville, MD: more diverse
- Carroll Manor, Takoma Park, MD: less diverse
- Langley Park, Hyattsville, MD: less diverse
- New Hampshire Gardens, Takoma Park, MD: more diverse
- Barnaby Woods, Washington, DC: less diverse
Neighborhoods with Similar Populations
- Excelsior, San Francisco, CA: less diverse
- Clinton Hill, Brooklyn, NY: less diverse
- Clinton, Manhattan, NY: less diverse
- Columbia Heights, Washington, DC: less diverse
- Country Club, Bronx, NY: less diverse
- Crenshaw, Los Angeles, CA: less diverse
- Deanwood, Washington, DC: less diverse
- Desert View, Phoenix, AZ: less diverse
- Downtown Memphis, Memphis, TN: less diverse
- Downtown San Francisco, San Francisco, CA: more diverse