The map below shows majority race by area in Yuma Townsite, as self-identified on the US census. Darker shades indicate a larger racial majority in that neighborhood. This page also contains data and maps on Yuma Townsite racial diversity and diversity scores. Click here to scroll to diversity data.

WhiteHispanicBlackAsianMultiple/Other
Majority race by area
The majority race in Yuma Townsite overall is hispanic, making up 71.9% of residents. The next most-common racial group is white at 18.8%. There are more hispanic people in the west areas of the neighborhood. People who identify as white are most likely to be living in the east places. The data below shows how many people identify themselves as each of the following races, which most Americans base on their family's national origin:
Race in Yuma Townsite
Self-Identified Race |
Yuma Townsite, Yuma, AZ Population |
|---|---|
White |
18.8% |
Hispanic |
71.9% |
Black |
4.5% |
Asian |
0.0% |
Native American |
2.9% |
Other |
1.8% |
Diversity and Diversity Scores for Yuma Townsite, Yuma, AZ
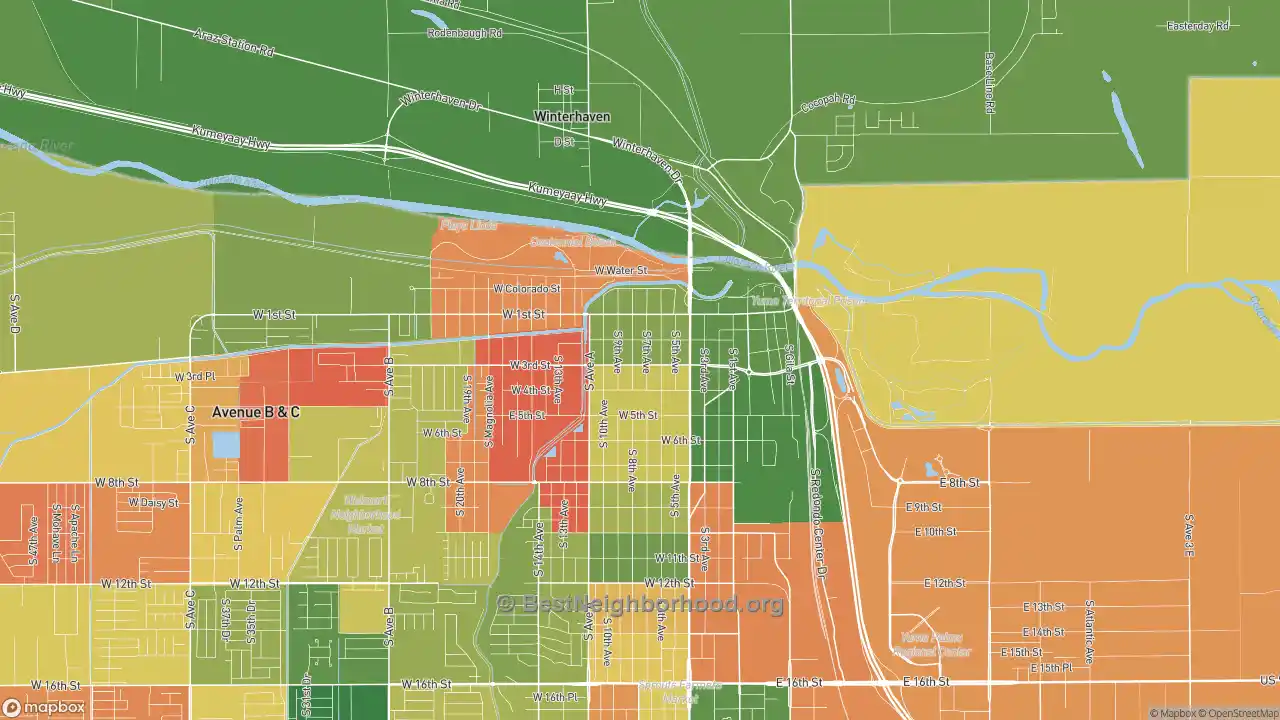
The map below shows diversity in Yuma Townsite. Areas in green are more diverse, while areas in red are much less diverse. Diversity, in this case, means a mixture of people with different race and ethnicity living close to one another. For example, all-black and all-white areas in the neighborhood would both be considered lacking diversity.
More diverse
Less diverse
Colorblind friendly
off
Yuma Townsite Diversity Score
34
With a diversity score of 34 out of 100, Yuma Townsite is less diverse than other US neighborhoods. The most diverse area within Yuma Townsite's proper boundaries is to the southeast of the neighborhood. The least diverse areas are located in the west parts of Yuma Townsite.
Data Sources: U.S. Census, proprietary data mapping and analysis. Special thanks to the University of Virginia.
Nearby Neighborhoods
- Foothills, Fortuna Foothills, AZ: less diverse
- Granite Hills, El Cajon, CA: less diverse
- Winter Gardens, Lakeside, CA: less diverse
- Eastlake Vistas, Chula Vista, CA: more diverse
- Eastlake Trails, Chula Vista, CA: more diverse
- Rolling Hills Ranch, Chula Vista, CA: more diverse
- Sky Ranch, Santee, CA: more diverse
- Estlake Greens, Chula Vista, CA: more diverse
- San Miguel Ranch, Chula Vista, CA: more diverse
- East Lake, Chula Vista, CA: more diverse
Neighborhoods with Similar Populations
- Alta Loma, Peoria, AZ: more diverse
- Assumption Parish, San Leandro, CA: more diverse
- Atchison Woods, Richmond, CA: more diverse
- Atlantic Boulevard Estates, Jacksonville, FL: more diverse
- Aviation, Detroit, MI: less diverse
- Bay Colony, Baldwin Harbor, NY: more diverse
- Bayswater, Indianapolis, IN: more diverse
- Beatties Ford-Trinity, Charlotte, NC: more diverse
- Sears Park Area, Abilene, TX: more diverse
- Silver Valley Addition, Sioux Falls, SD: less diverse