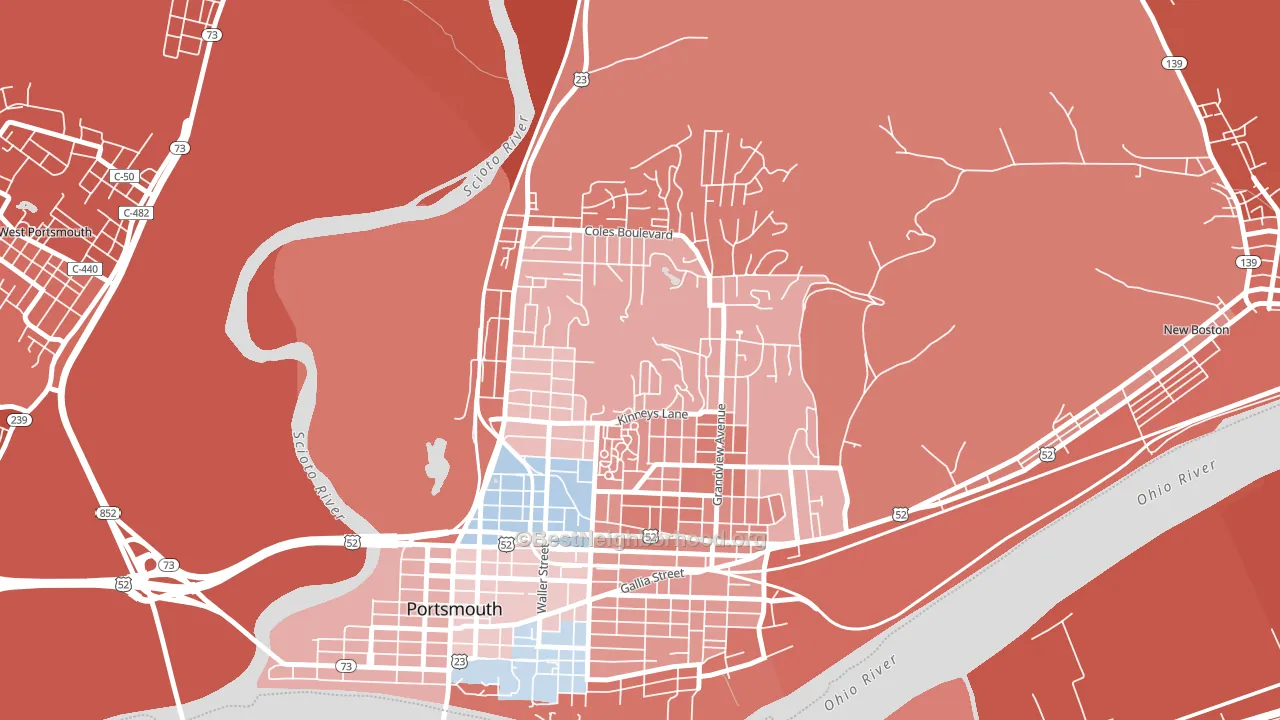
3rd Ward leans Republican by roughly 26 points: about 37% of voters vote Democratic and 63% Republican.
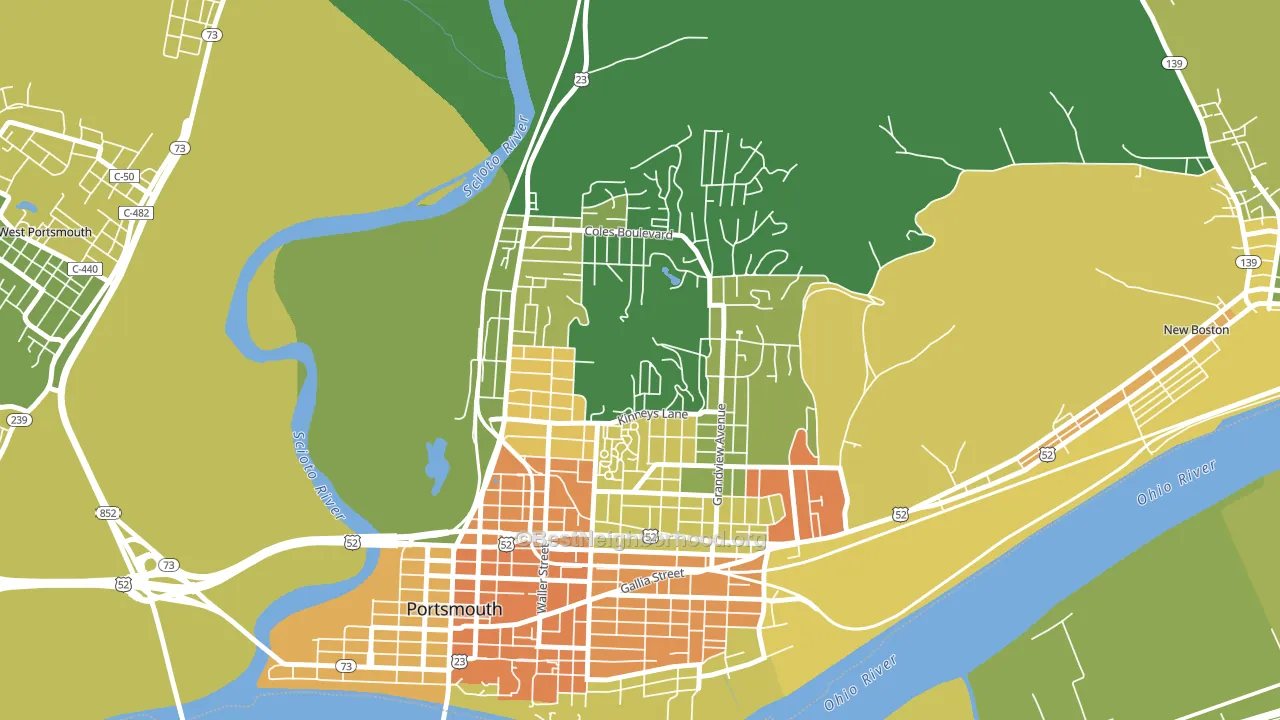
About 66% of adults in 3rd Ward typically vote, near the U.S. average of about 62%. Among adults in 3rd Ward, ~24% vote Democratic, ~42% Republican, and ~34% don't vote. The map below shows estimated turnout by block group.
How 3rd Ward compares
Among neighborhoods within 5 miles, 3rd Ward leans more Republican than 2 of 3 neighbors.
3rd Ward runs about 15 points more Republican than Ohio as a whole.
Politics vary noticeably by block within 3rd Ward. The northeast side is the most split-leaning (R+36) and the west side is the least split-leaning (R+2), a spread of about 33 points.
Why 3rd Ward leans the way it does
This analysis examined 14,881 data points per neighborhood to find what predicts political lean and turnout. The items below are a few correlations that stood out for 3rd Ward, not a ranked or complete list of what matters most.
Car-dependent areas vote Republican. About 86% of residents in 3rd Ward drive to work alone, about 12 points above the U.S. average of 74%. A high white share with below-average college attainment predicts Republican voting, and 3rd Ward fits that profile on both counts.
Walkability and Republican lean
Places with a low walkability score tend to lean Republican; 3rd Ward, Portsmouth, OH sits below the national average on this measure. A walkable street grid does not change how people vote; it mostly reflects how urban a place is.
Why turnout in 3rd Ward looks the way it does
Turnout in 3rd Ward sits close to the national pattern. Learn more about the findings and methodology on the political spectrum map.
Nearby Neighborhoods
- 1st Ward, Portsmouth, OH R+12
- 4th Ward, Portsmouth, OH R+25
- 6th Ward, Portsmouth, OH R+46
- Rankin Historic District, Ironton, OH R+24
- West Huntington, Huntington, WV R+13
- Southside, Huntington, WV D+31
- Circleville Historic District, Circleville, OH R+23
- Washington Court House Historic District, Washington Court H R+44
- Wilmington Historic District, Wilmington, OH R+27
- Lancaster Historic District, Lancaster, OH R+15
Neighborhoods with Similar Populations
- Windham, Coral Springs, FL D+9
- Edgewood, Michigan City, IN D+15
- Elton Hills, Rochester, MN D+28
- Rosedale Park, Detroit, MI D+88
- Rickarby, Mobile, AL D+72
- South End Springfield, Springfield, MA D+40
- Morningside, Pittsburgh, PA D+50
- Peacock Village, Peoria, AZ R+17
- Darkesville, Inwood, WV R+35
- Bluemound Heights, Milwaukee, WI D+36
Sources and methodology
Precinct-level voting records used to fit the model come from Ohio Secretary of State, Elections, distributed by the Voting and Election Science Team. Demographic inputs come from the U.S. Census Bureau (ACS 5-year estimates and the 2020 Decennial Census). Health and environmental inputs come from the CDC (PLACES and the Environmental Justice Index). Land cover comes from the USGS and EPA. Election-day and lead-up weather come from PRISM 4km daily grids and the NOAA Global Historical Climatology Network. Mail-voting and election-administration patterns come from the MIT Election Lab's Survey of the Performance of American Elections. Block-group crime detail comes from CrimeGrade. Internet data and modeling support provided by ISPreports.org.
Modeling and analysis by the BestNeighborhood data science team. Full methodology and findings: political spectrum map.
Methodology reviewed by the BestNeighborhood data team. Last updated May 2026.