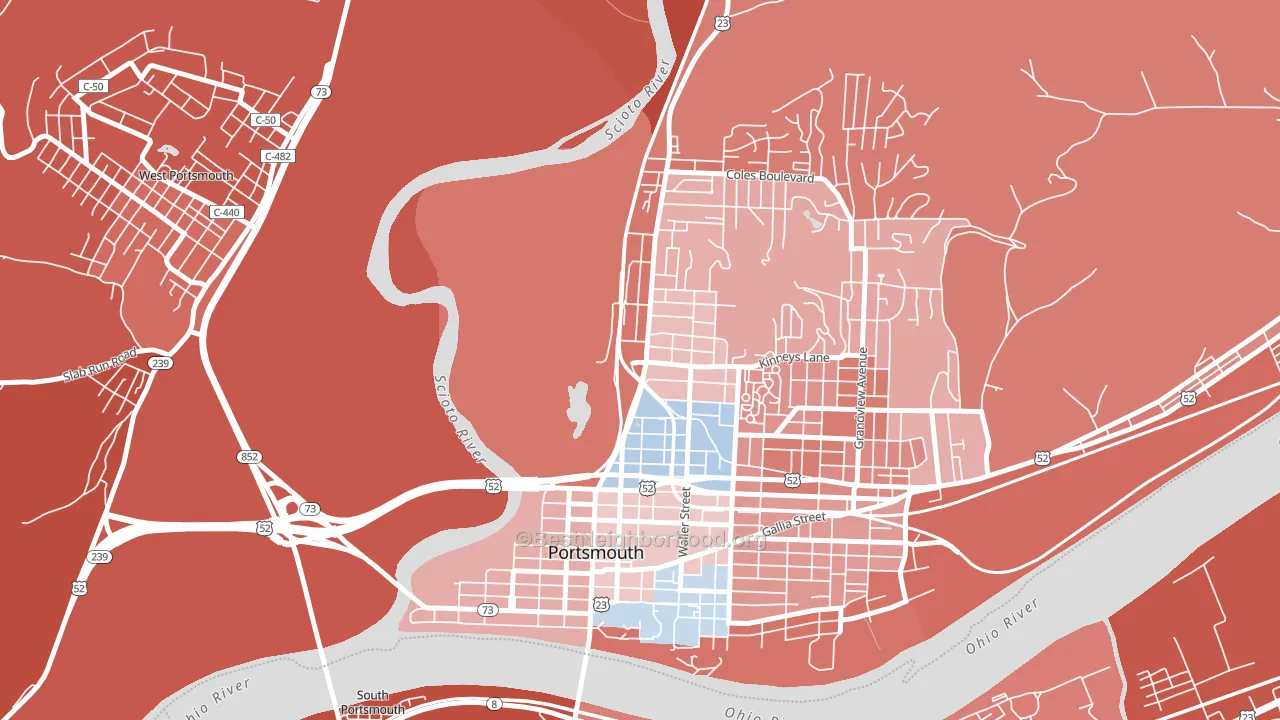
1st Ward leans slightly Republican by roughly 12 points: about 44% of voters vote Democratic and 56% Republican.
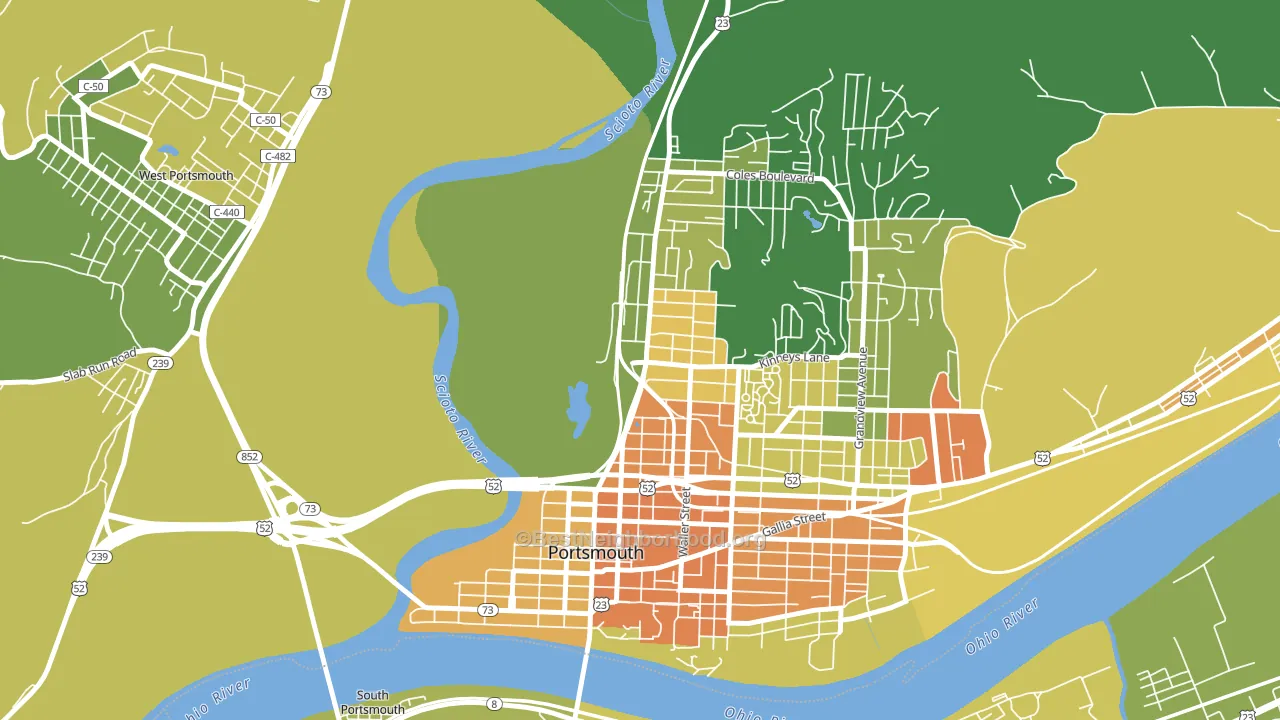
About 56% of adults in 1st Ward typically vote, below the U.S. average of about 62%. Among adults in 1st Ward, ~25% vote Democratic, ~31% Republican, and ~44% don't vote. The map below shows estimated turnout by block group.
How 1st Ward compares
Among neighborhoods within 5 miles, 1st Ward is the least Republican-leaning.
Politically, 1st Ward sits close to the rest of Ohio.
Politics vary noticeably by block within 1st Ward. The southwest side runs the most Democratic (D+3) and the northwest side runs the most Republican (R+42), a spread of about 45 points.
Why 1st Ward leans the way it does
This analysis examined 14,881 data points per neighborhood to find what predicts political lean and turnout. The items below are a few correlations that stood out for 1st Ward, not a ranked or complete list of what matters most.
Areas with a high white share and below-average college attainment vote Republican. In 1st Ward, about 81% of residents are non-Hispanic white, about 8 points above the U.S. average of 72%; about 22% of adults hold a bachelor's degree, about 6 points below the U.S. average of 28%.
Developed land and Republican lean
Places with a rural land-use pattern tend to lean Republican; 1st Ward, Portsmouth, OH sits below the national average on this measure. Developed land does not change how people vote; it mostly reflects how urban a place is.
Why turnout in 1st Ward looks the way it does
Turnout in 1st Ward sits close to the national pattern. Routine healthcare access, homeownership, education, and food security all land near their national averages here. Learn more about the findings and methodology on the political spectrum map.
Nearby Neighborhoods
- 3rd Ward, Portsmouth, OH R+26
- 4th Ward, Portsmouth, OH R+25
- 6th Ward, Portsmouth, OH R+46
- Rankin Historic District, Ironton, OH R+24
- West Huntington, Huntington, WV R+13
- Southside, Huntington, WV D+31
- Circleville Historic District, Circleville, OH R+23
- Washington Court House Historic District, Washington Court H R+44
- Wilmington Historic District, Wilmington, OH R+27
- Lancaster Historic District, Lancaster, OH R+15
Neighborhoods with Similar Populations
- Feasterville, Feasterville-Trevose, PA R+13
- Downtown Geneva, Geneva, OH R+23
- Stockdale Greens, Bakersfield, CA R+15
- Old Redford, Detroit, MI D+83
- Enderly Park, Charlotte, NC D+80
- Silver Swan, Milwaukee, WI D+74
- Downtown Ashland, Ashland, OH R+32
- Goodby's Creek, Jacksonville, FL R+8
- Central Business District-Rochester, Rochester, NY D+64
- Lincoln, San Rafael, CA D+51
Sources and methodology
Precinct-level voting records used to fit the model come from Ohio Secretary of State, Elections, distributed by the Voting and Election Science Team. Demographic inputs come from the U.S. Census Bureau (ACS 5-year estimates and the 2020 Decennial Census). Health and environmental inputs come from the CDC (PLACES and the Environmental Justice Index). Land cover comes from the USGS and EPA. Election-day and lead-up weather come from PRISM 4km daily grids and the NOAA Global Historical Climatology Network. Mail-voting and election-administration patterns come from the MIT Election Lab's Survey of the Performance of American Elections. Block-group crime detail comes from CrimeGrade. Internet data and modeling support provided by ISPreports.org.
Modeling and analysis by the BestNeighborhood data science team. Full methodology and findings: political spectrum map.
Methodology reviewed by the BestNeighborhood data team. Last updated May 2026.