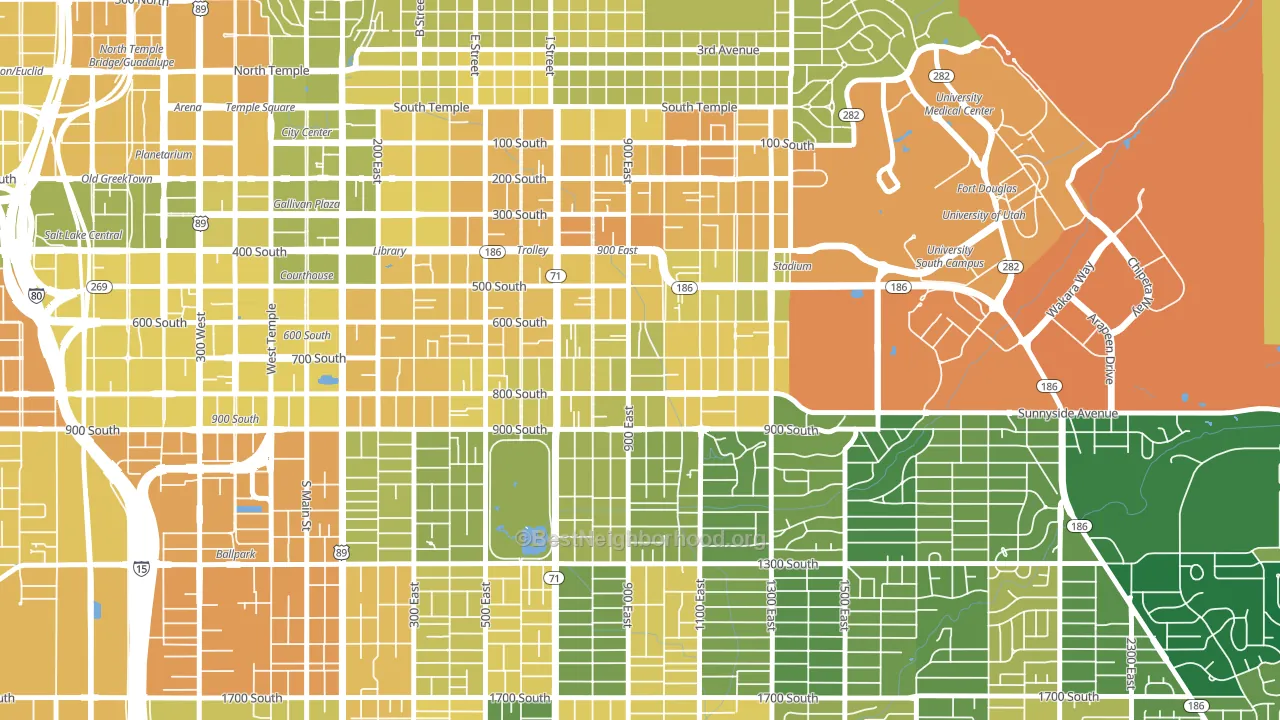
9th and 9th is a Democratic stronghold. About 85% of voters here vote Democratic and 15% Republican.
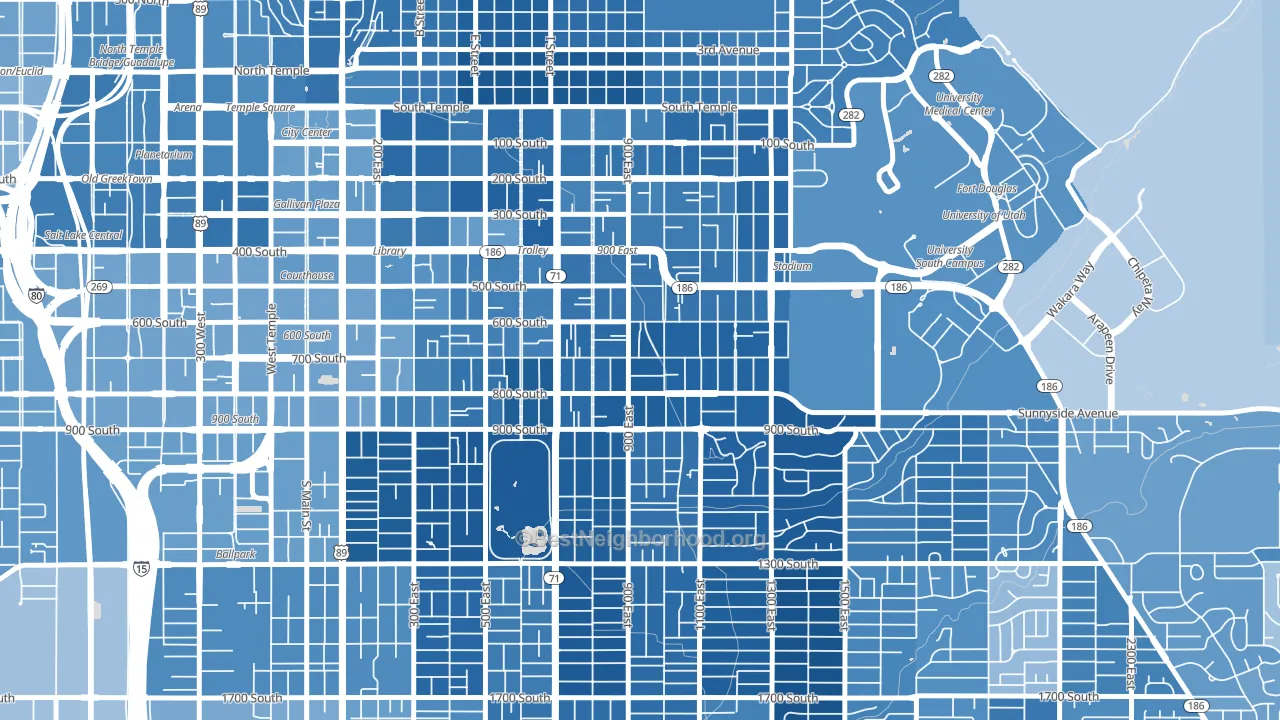
About 58% of adults in 9th and 9th typically vote, near the U.S. average of about 62%. Among adults in 9th and 9th, ~49% vote Democratic, ~9% Republican, and ~42% don't vote. The map below shows estimated turnout by block group.
How 9th and 9th compares
Among neighborhoods within 5 miles, 9th and 9th is the most Democratic-leaning.
9th and 9th runs about 92 points more Democratic than Utah as a whole. Utah leans Republican overall, while 9th and 9th is one of the few Democratic-leaning pockets.
Why 9th and 9th leans the way it does
This analysis examined 14,881 data points per neighborhood to find what predicts political lean and turnout. The items below are a few correlations that stood out for 9th and 9th, not a ranked or complete list of what matters most.
Dense areas vote Democratic. More than 99% of residents in 9th and 9th live in densely developed areas, about 64 points above the U.S. average of 36%. High college attainment predicts Democratic voting, and 9th and 9th sits in the top quarter (about 61%, above 82% of neighborhoods). 9th and 9th runs against the grain of Utah, a Democratic-leaning pocket in a Republican-leaning state.
Population density and Democratic lean
Places with high population density tend to lean Democratic; 9th and 9th, Salt Lake City, UT sits in the top quarter nationally on this measure.
Why turnout in 9th and 9th looks the way it does
High-crime urban areas turn out at lower rates, mostly because the housing stress common in those areas makes voting harder. 9th and 9th sits in the top 15% nationally on a violent-crime measure. See CrimeGrade for more details. Learn more about the findings and methodology on the political spectrum map.
Nearby Neighborhoods
- East Central, Salt Lake City, UT D+68
- Central City, Salt Lake City, UT D+60
- Central City Liberty Wells, Salt Lake City, UT D+66
- Yalecrest, Salt Lake City, UT D+61
- Wasatch Hollow, Salt Lake City, UT D+67
- The Avenues, Salt Lake City, UT D+64
- Liberty Wells, Salt Lake City, UT D+64
- People's Freeway, Salt Lake City, UT D+47
- Bonneville Hills, Salt Lake City, UT D+46
- Downtown, Salt Lake City, UT D+48
Neighborhoods with Similar Populations
- Geneva, Orem, UT R+17
- Southeast Ridgewood, Ridgewood, NJ D+25
- Far West, Wilsonville, OR D+18
- Athenia, Clifton, NJ D+5
- Victory, Minneapolis, MN D+57
- McKinney, Austin, TX D+34
- Parkwood Maintenance, San Antonio, TX D+11
- College Park, Mobile, AL R+31
- Medina Public Square Historic District, Medina, OH R+8
- Lake Lucina, Jacksonville, FL D+15
Sources and methodology
Precinct-level voting records used to fit the model come from Utah Lieutenant Governor's Office, Elections, distributed by the Voting and Election Science Team. Demographic inputs come from the U.S. Census Bureau (ACS 5-year estimates and the 2020 Decennial Census). Health and environmental inputs come from the CDC (PLACES and the Environmental Justice Index). Land cover comes from the USGS and EPA. Election-day and lead-up weather come from PRISM 4km daily grids and the NOAA Global Historical Climatology Network. Mail-voting and election-administration patterns come from the MIT Election Lab's Survey of the Performance of American Elections. Block-group crime detail comes from CrimeGrade. Internet data and modeling support provided by ISPreports.org.
Modeling and analysis by the BestNeighborhood data science team. Full methodology and findings: political spectrum map.
Methodology reviewed by the BestNeighborhood data team. Last updated May 2026.