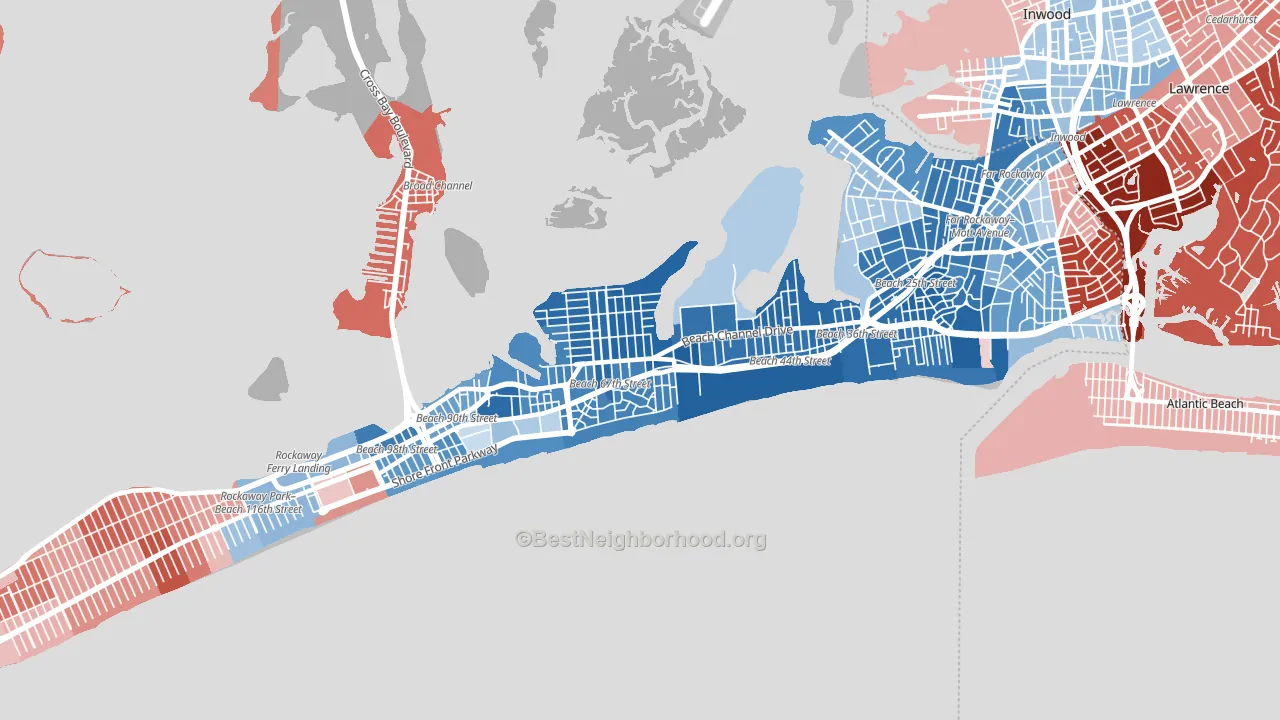
Arverne is a Democratic stronghold. About 82% of voters here vote Democratic and 18% Republican.
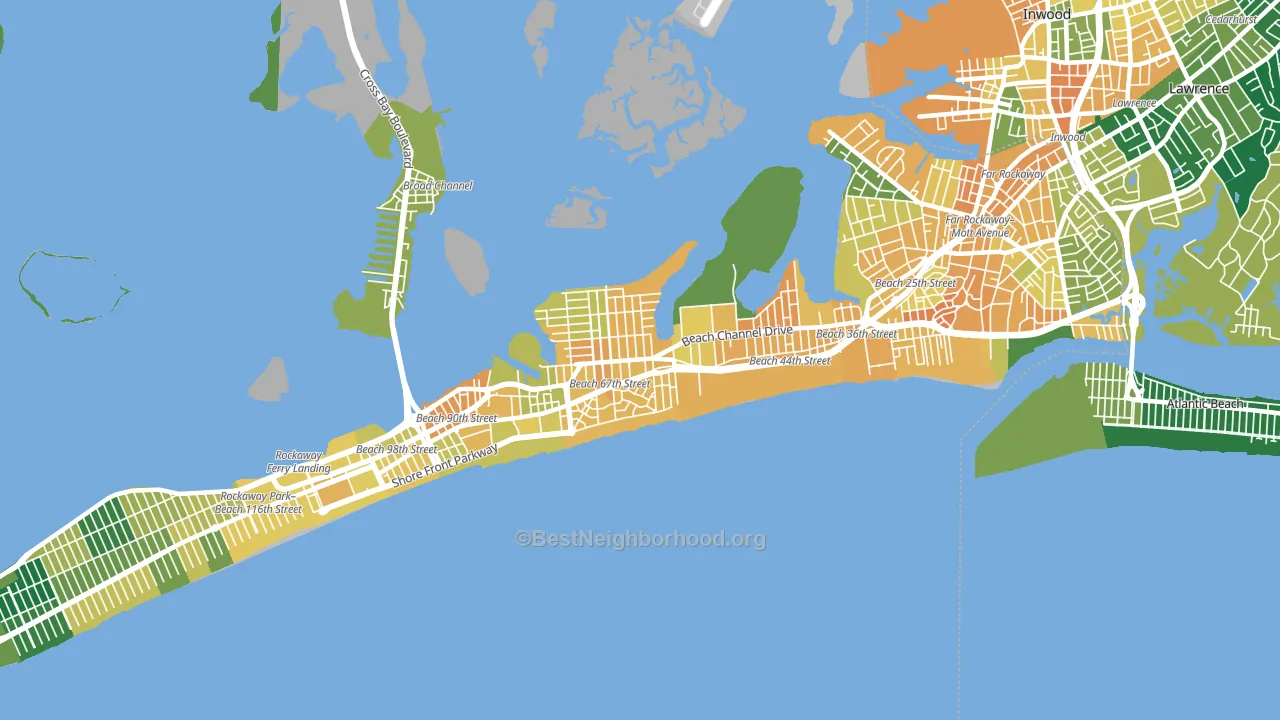
About 44% of adults in Arverne typically vote, below the U.S. average of about 62%. Among adults in Arverne, ~36% vote Democratic, ~8% Republican, and ~56% don't vote. The map below shows estimated turnout by block group.
How Arverne compares
Arverne sits in a sparsely populated area with few comparable neighborhoods nearby.
Arverne runs about 51 points more Democratic than New York as a whole.
Politics vary noticeably by block within Arverne. The north side is the most Democratic-leaning (D+73) and the southwest side is the least Democratic-leaning (D+25), a spread of about 48 points.
Why Arverne leans the way it does
This analysis examined 14,881 data points per neighborhood to find what predicts political lean and turnout. The items below are a few correlations that stood out for Arverne, not a ranked or complete list of what matters most.
Areas with many never-married adults vote Democratic. About 47% of adults in Arverne have never been married, modestly above similar-sized neighborhoods (around 41%).
Paved land cover and Democratic lean
Places with extensive paved surfaces tend to lean Democratic; Arverne, Queens, NY sits in the top quarter nationally on this measure. Paved ground does not change how people vote; it mostly reflects how urban and built-up a place is.
Why turnout in Arverne looks the way it does
Areas with high food insecurity turn out at lower rates. About 38% of adults in Arverne report food insecurity, about 22 points above the U.S. average of 16%. Renters vote less often than owners, and about 66% of households in Arverne rent, compared to around 39% in nearby neighborhoods. Low high-school completion lines up with lower turnout, and about 83% of adults in Arverne have completed high school, below 81% of neighborhoods. Learn more about the findings and methodology on the political spectrum map.
Nearby Neighborhoods
- Far Rockaway, Queens, NY D+39
- Rockaway Park, Queens, NY R+8
- Howard Beach, Queens, NY R+29
- Springfield Gardens, Queens, NY D+78
- Rosedale, Queens, NY D+77
- South Ozone Park, Queens, NY D+31
- Rochdale Village, Queens, NY D+83
- Laurelton, Queens, NY D+82
- Bergen Beach, Brooklyn, NY R+24
- Locust Manor, Queens, NY D+75
Neighborhoods with Similar Populations
- Gold Coast, Chicago, IL D+54
- Brightwood, Washington, DC D+77
- Northwood, Irvine, CA D+10
- Green Valley South, Henderson, NV D+8
- Northshore, Houston, TX D+20
- Fort Bend Houston, Missouri City, TX D+68
- Hunts Point, Bronx, NY D+44
- Fox Chase-Burholme, Philadelphia, PA D+7
- The Plaza, Long Beach, CA D+18
- Southeast Boulder, Boulder, CO D+69
Sources and methodology
Precinct-level voting records used to fit the model come from New York State Board of Elections, distributed by the Voting and Election Science Team. Demographic inputs come from the U.S. Census Bureau (ACS 5-year estimates and the 2020 Decennial Census). Health and environmental inputs come from the CDC (PLACES and the Environmental Justice Index). Land cover comes from the USGS and EPA. Election-day and lead-up weather come from PRISM 4km daily grids and the NOAA Global Historical Climatology Network. Mail-voting and election-administration patterns come from the MIT Election Lab's Survey of the Performance of American Elections. Block-group crime detail comes from CrimeGrade. Internet data and modeling support provided by ISPreports.org.
Modeling and analysis by the BestNeighborhood data science team. Full methodology and findings: political spectrum map.
Methodology reviewed by the BestNeighborhood data team. Last updated May 2026.