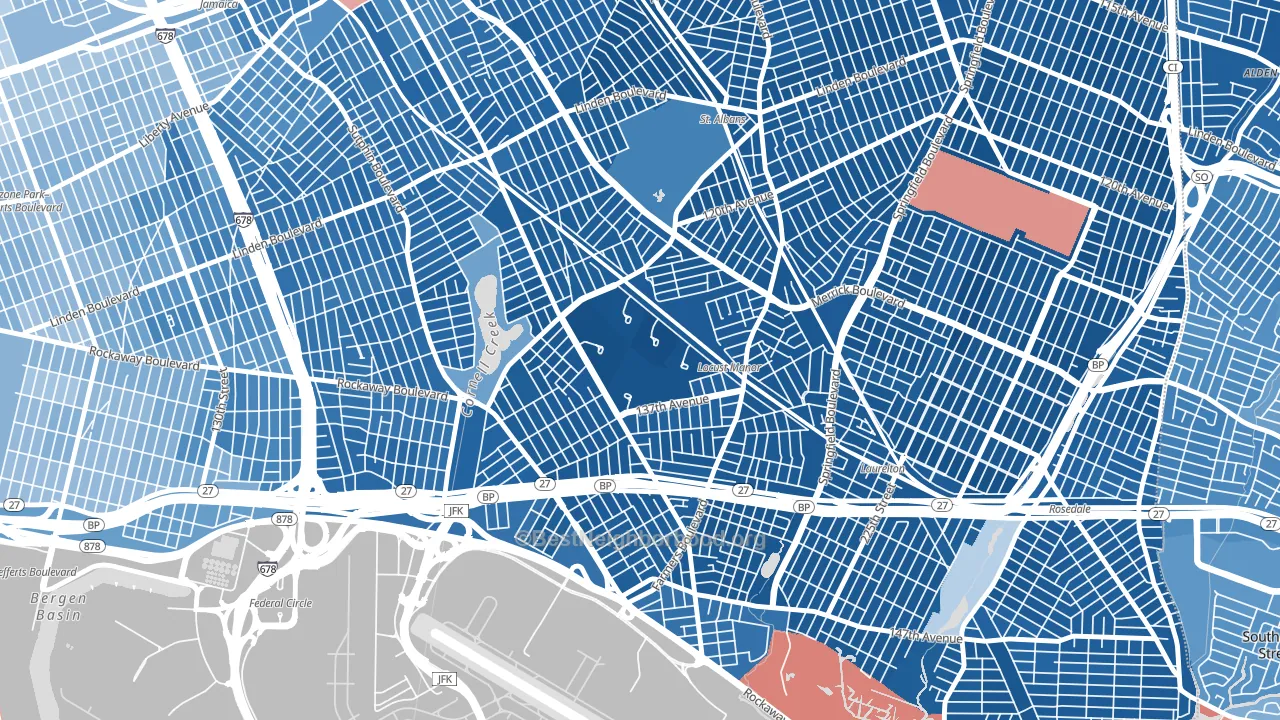
Rochdale Village is a Democratic stronghold. About 91% of voters here vote Democratic and 9% Republican.
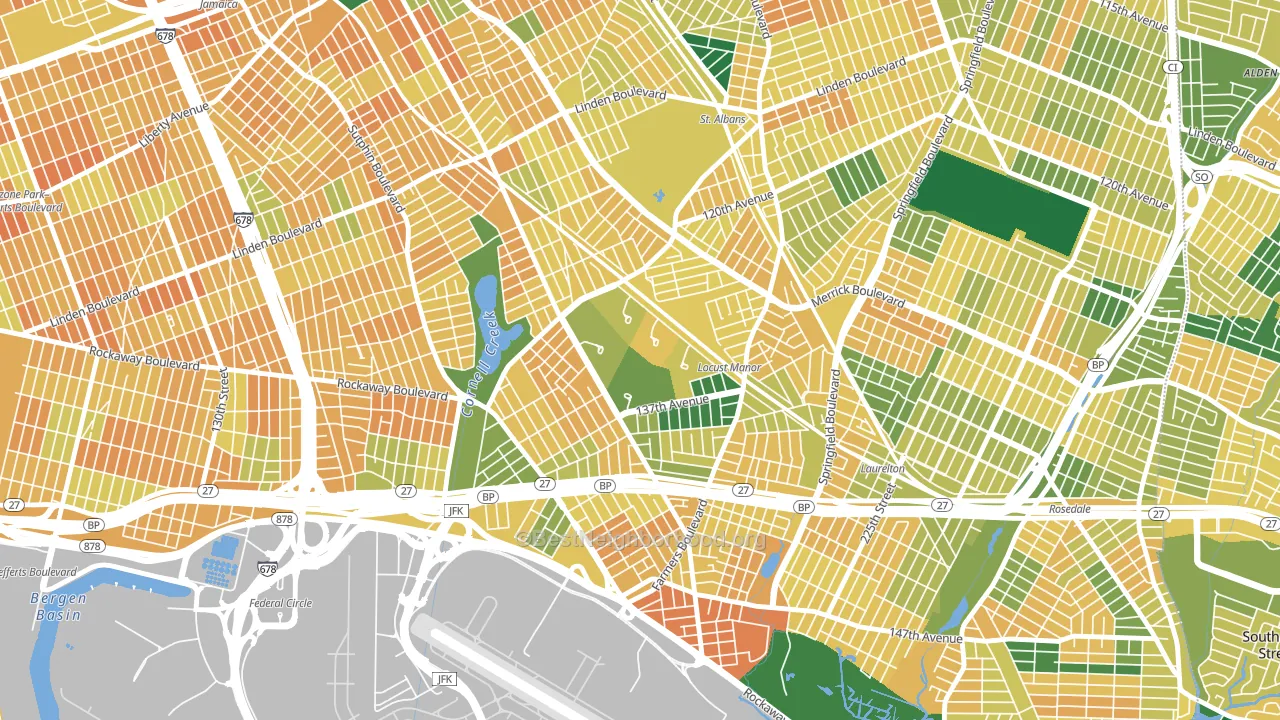
About 56% of adults in Rochdale Village typically vote, below the U.S. average of about 62%. Among adults in Rochdale Village, ~51% vote Democratic, ~5% Republican, and ~44% don't vote. The map below shows estimated turnout by block group.
How Rochdale Village compares
Among neighborhoods within 5 miles, Rochdale Village leans more Democratic than 17 of 18 neighbors.
Rochdale Village runs about 70 points more Democratic than New York as a whole.
Why Rochdale Village leans the way it does
This analysis examined 14,881 data points per neighborhood to find what predicts political lean and turnout. The items below are a few correlations that stood out for Rochdale Village, not a ranked or complete list of what matters most.
Areas with many never-married adults vote Democratic. About 47% of adults in Rochdale Village have never been married, modestly above similar-sized neighborhoods (around 40%).
Population density and Democratic lean
Places with high population density tend to lean Democratic; Rochdale Village, Queens, NY sits in the top tenth nationally on this measure.
Why turnout in Rochdale Village looks the way it does
Areas with strong routine healthcare access turn out at higher rates. Rochdale Village is in the top quarter nationally for routine-care measures such as insurance coverage, preventive screenings, and dental visits. The dental-visit rate here is about 58%, below 61% of neighborhoods. Learn more about the findings and methodology on the political spectrum map.
Nearby Neighborhoods
- Springfield Gardens, Queens, NY D+78
- Locust Manor, Queens, NY D+75
- Laurelton, Queens, NY D+82
- St Albans, Queens, NY D+78
- Cambria Heights, Queens, NY D+84
- Rosedale, Queens, NY D+77
- South Ozone Park, Queens, NY D+31
- Hollis, Queens, NY D+49
- Jamaica, Queens, NY D+36
- Richmond Hill, Queens, NY D+18
Neighborhoods with Similar Populations
- Wharton-Hawthorne-Bella Vista, Philadelphia, PA D+60
- South Baton Rouge, Baton Rouge, LA D+12
- West Park, Irvine, CA D+14
- Upper Roseville, Newark, NJ D+23
- Prospect Hill, San Antonio, TX D+39
- Brentwood, Los Angeles, CA D+27
- Cedar Brook, Philadelphia, PA D+90
- Midway, Escondido, CA D+14
- Battle Creek, St. Paul, MN D+39
- Visitacion Valley, San Francisco, CA D+36
Sources and methodology
Precinct-level voting records used to fit the model come from New York State Board of Elections, distributed by the Voting and Election Science Team. Demographic inputs come from the U.S. Census Bureau (ACS 5-year estimates and the 2020 Decennial Census). Health and environmental inputs come from the CDC (PLACES and the Environmental Justice Index). Land cover comes from the USGS and EPA. Election-day and lead-up weather come from PRISM 4km daily grids and the NOAA Global Historical Climatology Network. Mail-voting and election-administration patterns come from the MIT Election Lab's Survey of the Performance of American Elections. Block-group crime detail comes from CrimeGrade. Internet data and modeling support provided by ISPreports.org.
Modeling and analysis by the BestNeighborhood data science team. Full methodology and findings: political spectrum map.
Methodology reviewed by the BestNeighborhood data team. Last updated May 2026.