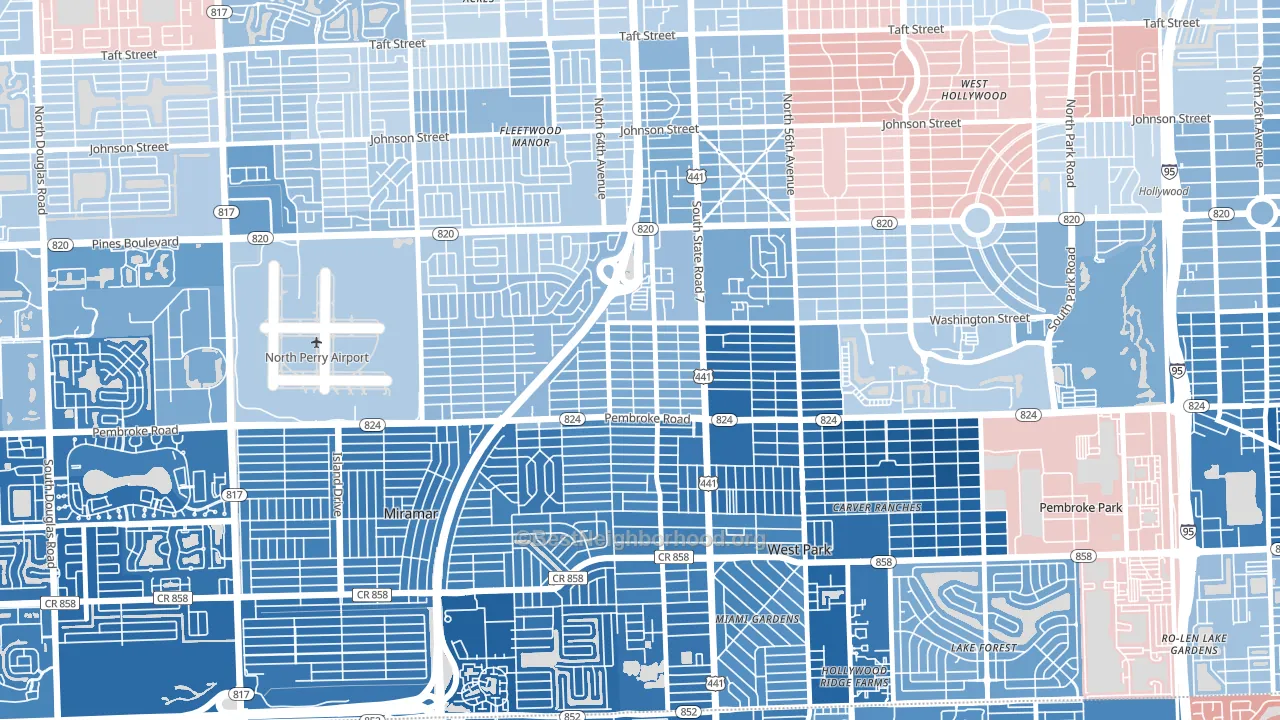
Beverly Park leans Democratic by roughly 30 points: about 65% of voters vote Democratic and 35% Republican.
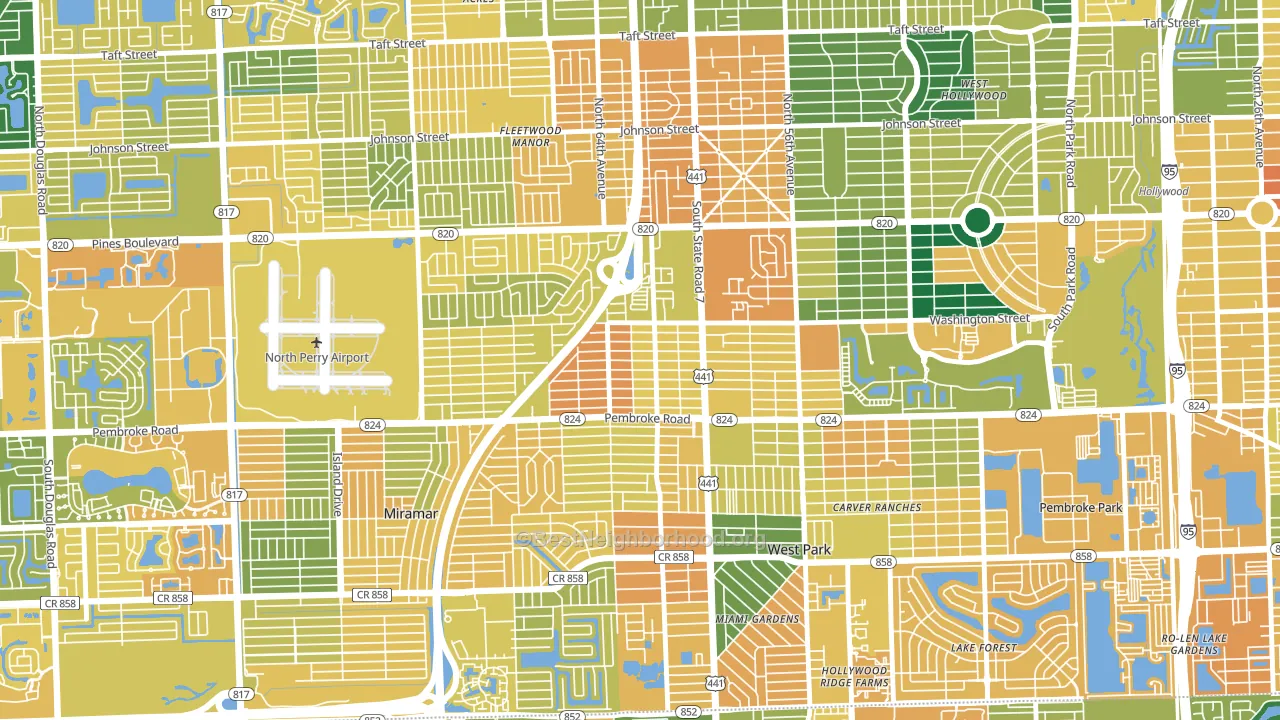
About 46% of adults in Beverly Park typically vote, below the U.S. average of about 62%. Among adults in Beverly Park, ~30% vote Democratic, ~16% Republican, and ~54% don't vote. The map below shows estimated turnout by block group.
How Beverly Park compares
Among neighborhoods within 5 miles, Beverly Park leans more Democratic than 7 of 11 neighbors.
Beverly Park runs about 42 points more Democratic than Florida as a whole. Florida leans Republican overall, while Beverly Park is one of the few Democratic-leaning pockets.
Politics vary noticeably by block within Beverly Park. The south side is the most Democratic-leaning (D+45) and the northwest side is the least Democratic-leaning (D+22), a spread of about 23 points.
Why Beverly Park leans the way it does
This analysis examined 14,881 data points per neighborhood to find what predicts political lean and turnout. The items below are a few correlations that stood out for Beverly Park, not a ranked or complete list of what matters most.
Beverly Park votes against the grain of Florida. Florida leans Republican overall, while Beverly Park runs about 42 points more Democratic. Density combined with diversity predicts Democratic voting, and non-Hispanic white share in Beverly Park is about 12%, about 60 points below the U.S. average of 72%.
Walkability and Democratic lean
Places with a highly walkable street grid tend to lean Democratic; Beverly Park, Hollywood, FL sits in the top quarter nationally on this measure. A walkable street grid does not change how people vote; it mostly reflects how urban a place is.
Why turnout in Beverly Park looks the way it does
Areas with limited routine healthcare access turn out at lower rates. Beverly Park is in the bottom quarter nationally for routine-care measures such as insurance coverage, preventive screenings, and dental visits. The dental-visit rate here is about 48%, about 9 points below the Florida average of 56%. Low high-school completion lines up with lower turnout, and about 76% of adults in Beverly Park have completed high school, below 90% of neighborhoods. Learn more about the findings and methodology on the political spectrum map.
Nearby Neighborhoods
- Hollywood Hills, Hollywood, FL D+6
- 441 Corridor, Hollywood, FL D+11
- Walnut Creek, Pembroke Pines, FL D+18
- Driftwood, Hollywood, FL D+6
- Lakeshore at University Park, Miramar, FL D+58
- Highland Garden, Hollywood, FL D+37
- Washington Park, Hollywood, FL D+62
- Parkside, Hollywood, FL D+19
- Liberia, Hollywood, FL D+52
- Royal Poinciana, Hollywood, FL D+20
Neighborhoods with Similar Populations
- Coventry, Crystal Lake, IL D+5
- Northeast Village, West Sacramento, CA D+26
- Yorkwood, Mobile, AL R+29
- Mitchell West, Milwaukee, WI D+9
- Randall Hills, North Aurora, IL D+13
- Rosedale, Camden, NJ D+50
- Liberia, Hollywood, FL D+52
- Yuma Townsite, Yuma, AZ D+8
- Village 5, Sacramento, CA D+42
- Beatties Ford-Trinity, Charlotte, NC D+75
Sources and methodology
Precinct-level voting records used to fit the model come from Florida Division of Elections, distributed by the Voting and Election Science Team. Demographic inputs come from the U.S. Census Bureau (ACS 5-year estimates and the 2020 Decennial Census). Health and environmental inputs come from the CDC (PLACES and the Environmental Justice Index). Land cover comes from the USGS and EPA. Election-day and lead-up weather come from PRISM 4km daily grids and the NOAA Global Historical Climatology Network. Mail-voting and election-administration patterns come from the MIT Election Lab's Survey of the Performance of American Elections. Block-group crime detail comes from CrimeGrade. Internet data and modeling support provided by ISPreports.org.
Modeling and analysis by the BestNeighborhood data science team. Full methodology and findings: political spectrum map.
Methodology reviewed by the BestNeighborhood data team. Last updated May 2026.