Brunswick County leans Republican by roughly 30 points: about 35% of voters vote Democratic and 65% Republican.
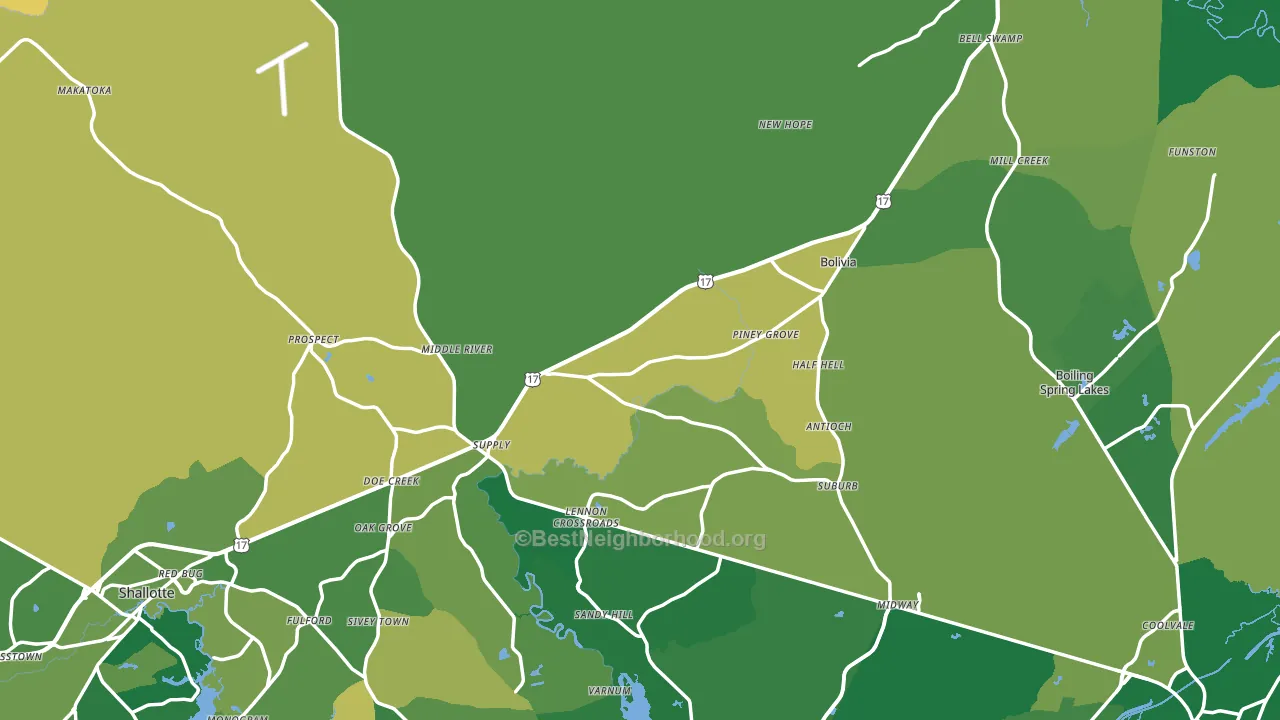
About 91% of adults in Brunswick County typically vote, above the U.S. average of about 62%. Among adults in Brunswick County, ~32% vote Democratic, ~59% Republican, and ~9% don't vote. The map below shows estimated turnout by block group.
How Brunswick County compares
Among counties within 50 miles, Brunswick County leans more Republican than 3 of 5 neighbors.
Brunswick County runs about 26 points more Republican than North Carolina as a whole.
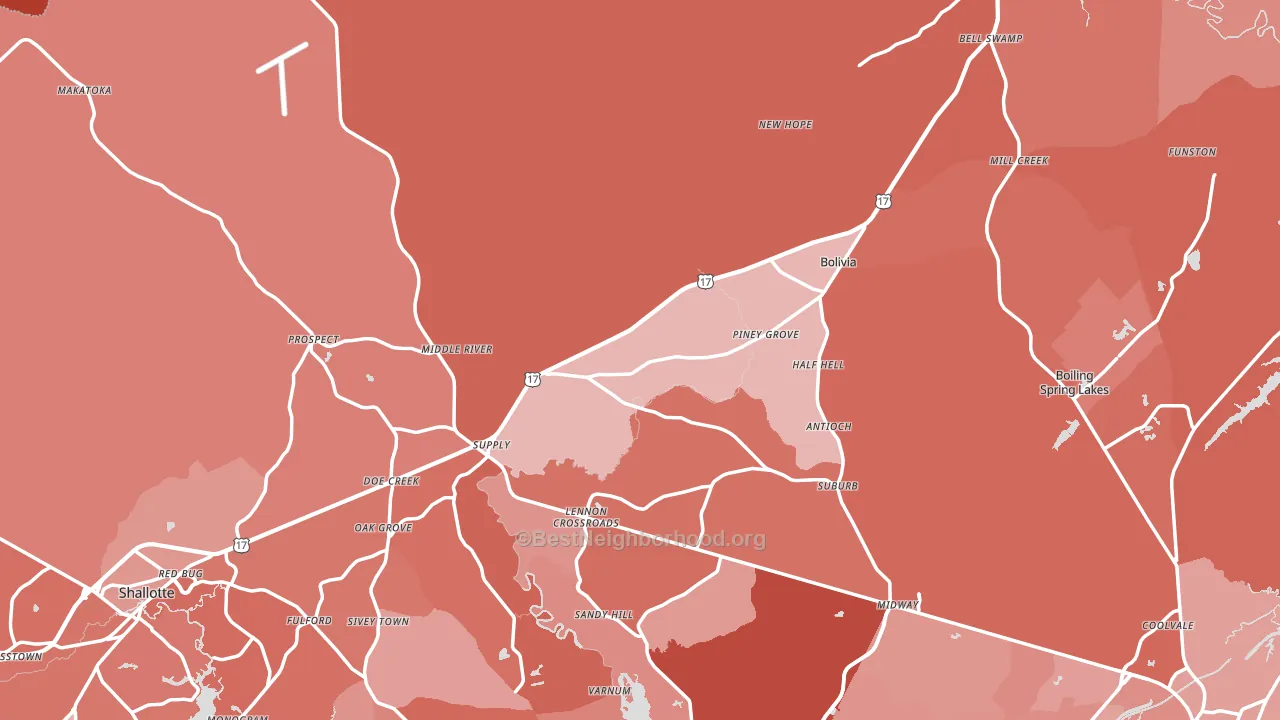
Politics vary noticeably by city within Brunswick County. The northwest side is the most Republican-leaning (R+48) and the southeast side is the least Republican-leaning (R+17), a spread of about 31 points.
Why Brunswick County leans the way it does
This analysis examined 14,881 data points per county to find what predicts political lean and turnout. The items below are a few correlations that stood out for Brunswick County, not a ranked or complete list of what matters most.
Areas with many family households vote Republican. About 69% of households in Brunswick County are family households, above 77% of counties.
Preventive-care access and voter turnout
Places with strong routine preventive-care access tend to turn out at a higher rate; Brunswick County, NC sits in the top tenth nationally on this measure. Dental visits do not drive turnout; the rate reflects income, insurance, and healthcare access, which line up with who votes.
Why turnout in Brunswick County looks the way it does
Areas with strong routine healthcare access turn out at higher rates. Brunswick County is in the top quarter nationally for routine-care measures such as insurance coverage, preventive screenings, and dental visits. The dental-visit rate here is about 68%, about 8 points above the U.S. average of 60%. Homeowners vote more often than renters, and about 84% of households in Brunswick County own their home, above 95% of counties. Learn more about the findings and methodology on the political spectrum map.
Nearby Counties
- New Hanover County, NC D+5
- Columbus County, NC R+27
- Pender County, NC R+33
- Horry County, SC R+30
- Bladen County, NC R+17
- Duplin County, NC R+23
- Marion County, SC D+17
- Robeson County, NC R+13
- Onslow County, NC R+23
- Sampson County, NC R+26
Counties with Similar Populations
- Washington County, WI R+28
- Humboldt County, CA D+27
- Florence County, SC Even
- Hampton City, VA D+41
- Clark County, OH R+21
- Boone County, KY R+28
- Grayson County, TX R+43
- Marathon County, WI R+17
- Napa County, CA D+32
- Blount County, TN R+49
Sources and methodology
Precinct-level voting records used to fit the model come from North Carolina State Board of Elections, distributed by the Voting and Election Science Team. Demographic inputs come from the U.S. Census Bureau (ACS 5-year estimates and the 2020 Decennial Census). Health and environmental inputs come from the CDC (PLACES and the Environmental Justice Index). Land cover comes from the USGS and EPA. Election-day and lead-up weather come from PRISM 4km daily grids and the NOAA Global Historical Climatology Network. Mail-voting and election-administration patterns come from the MIT Election Lab's Survey of the Performance of American Elections. Block-group crime detail comes from CrimeGrade. Internet data and modeling support provided by ISPreports.org.
Modeling and analysis by the BestNeighborhood data science team. Full methodology and findings: political spectrum map.
Methodology reviewed by the BestNeighborhood data team. Last updated May 2026.