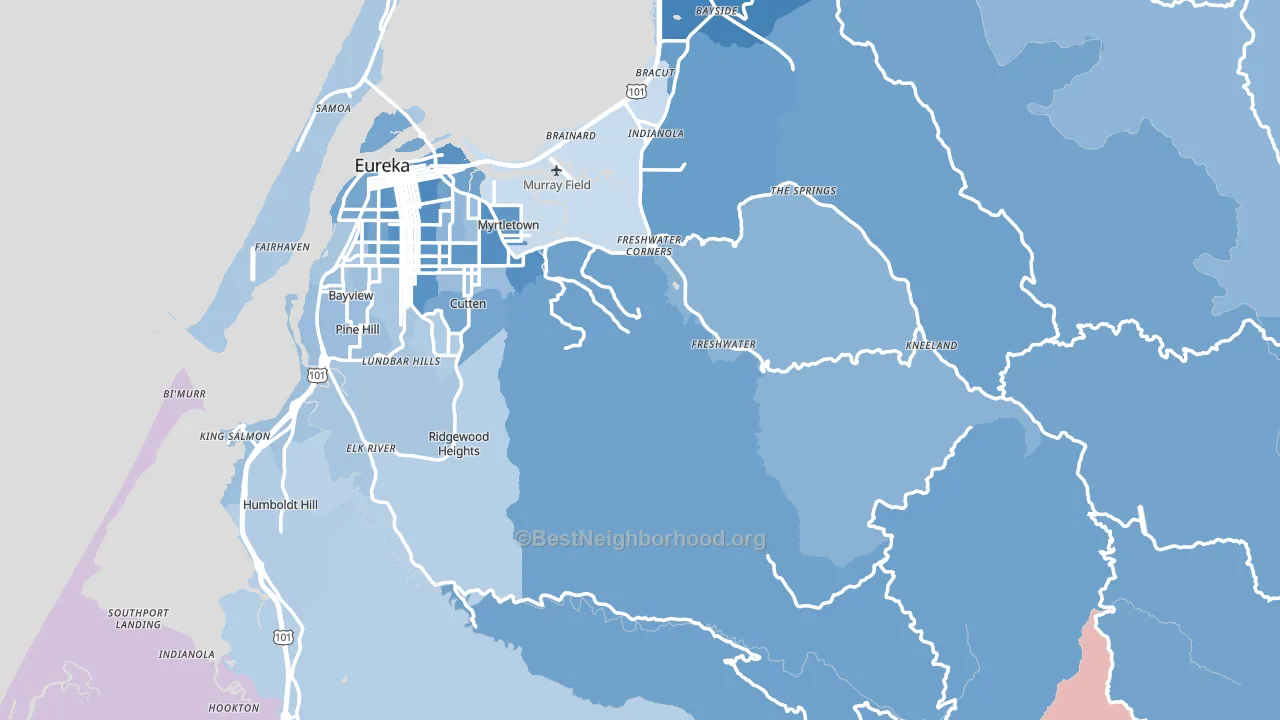
Humboldt County leans Democratic by roughly 26 points: about 63% of voters vote Democratic and 37% Republican.
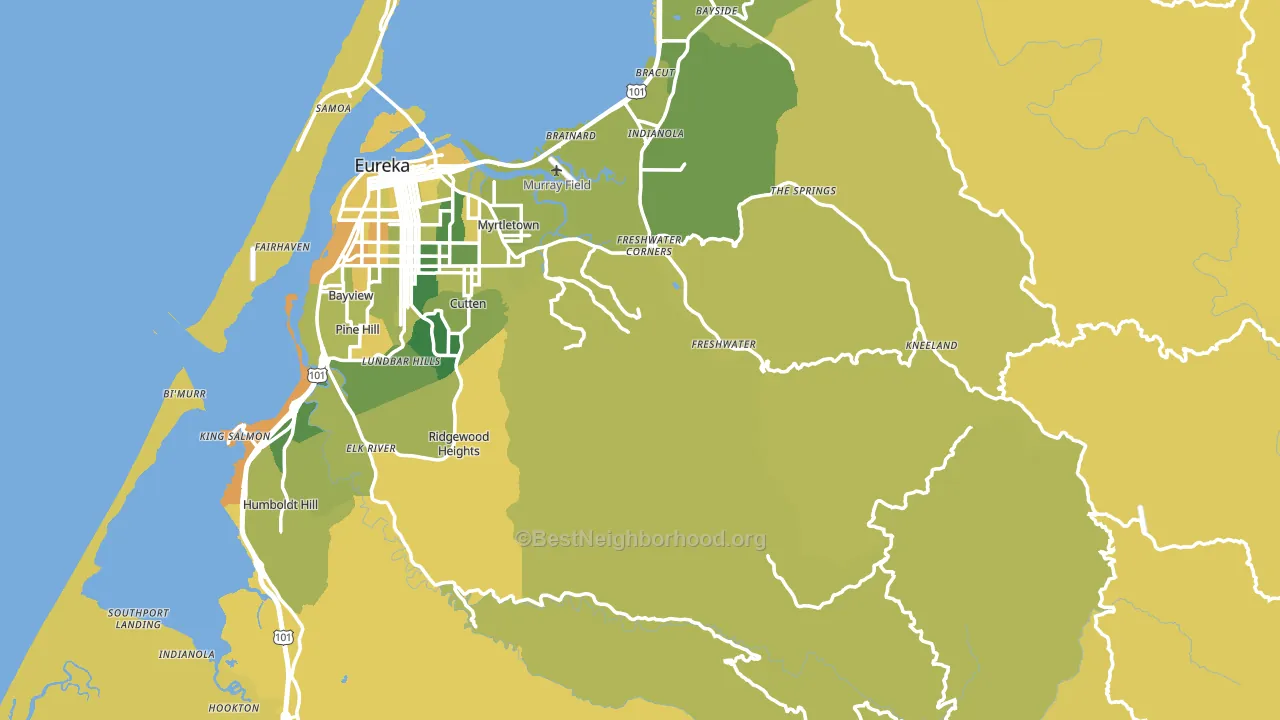
About 65% of adults in Humboldt County typically vote, near the U.S. average of about 62%. Among adults in Humboldt County, ~41% vote Democratic, ~24% Republican, and ~35% don't vote. The map below shows estimated turnout by block group.
How Humboldt County compares
Humboldt County runs about 6 points more Democratic than California as a whole.
Politics vary noticeably by city within Humboldt County. The northwest side runs the most Democratic (D+45) and the south side runs the most Republican (R+5), a spread of about 50 points.
Why Humboldt County leans the way it does
This analysis examined 14,881 data points per county to find what predicts political lean and turnout. The items below are a few correlations that stood out for Humboldt County, not a ranked or complete list of what matters most.
Areas with high college attainment vote Democratic. About 33% of adults in Humboldt County hold a bachelor's degree, above 82% of counties. Density combined with diversity predicts Democratic voting, and non-Hispanic white share in Humboldt County is about 69%, below 66% of counties. A high never-married share predicts Democratic voting, and about 41% of adults in Humboldt County have never been married, above 94% of counties.
Population density and Democratic lean
Places with high population density tend to lean Democratic; Humboldt County, CA sits in the top quarter nationally on this measure.
Why turnout in Humboldt County looks the way it does
Turnout in Humboldt County sits close to the national pattern. Routine healthcare access, homeownership, education, and food security all land near their national averages here. Learn more about the findings and methodology on the political spectrum map.
Nearby Counties
- Trinity County, CA R+14
- Del Norte County, CA R+15
- Shasta County, CA R+30
- Siskiyou County, CA R+17
- Curry County, OR R+11
- Tehama County, CA R+35
- Mendocino County, CA D+23
- Josephine County, OR R+25
- Glenn County, CA R+32
- Jackson County, OR R+3
Counties with Similar Populations
- Brunswick County, NC R+29
- Washington County, WI R+28
- Clark County, OH R+21
- Boone County, KY R+28
- Florence County, SC Even
- Hampton City, VA D+41
- Grayson County, TX R+43
- Blount County, TN R+49
- Marathon County, WI R+17
- Napa County, CA D+32
Sources and methodology
Precinct-level voting records used to fit the model come from California Secretary of State, Elections, distributed by the Voting and Election Science Team. Demographic inputs come from the U.S. Census Bureau (ACS 5-year estimates and the 2020 Decennial Census). Health and environmental inputs come from the CDC (PLACES and the Environmental Justice Index). Land cover comes from the USGS and EPA. Election-day and lead-up weather come from PRISM 4km daily grids and the NOAA Global Historical Climatology Network. Mail-voting and election-administration patterns come from the MIT Election Lab's Survey of the Performance of American Elections. Block-group crime detail comes from CrimeGrade. Internet data and modeling support provided by ISPreports.org.
Modeling and analysis by the BestNeighborhood data science team. Full methodology and findings: political spectrum map.
Methodology reviewed by the BestNeighborhood data team. Last updated May 2026.