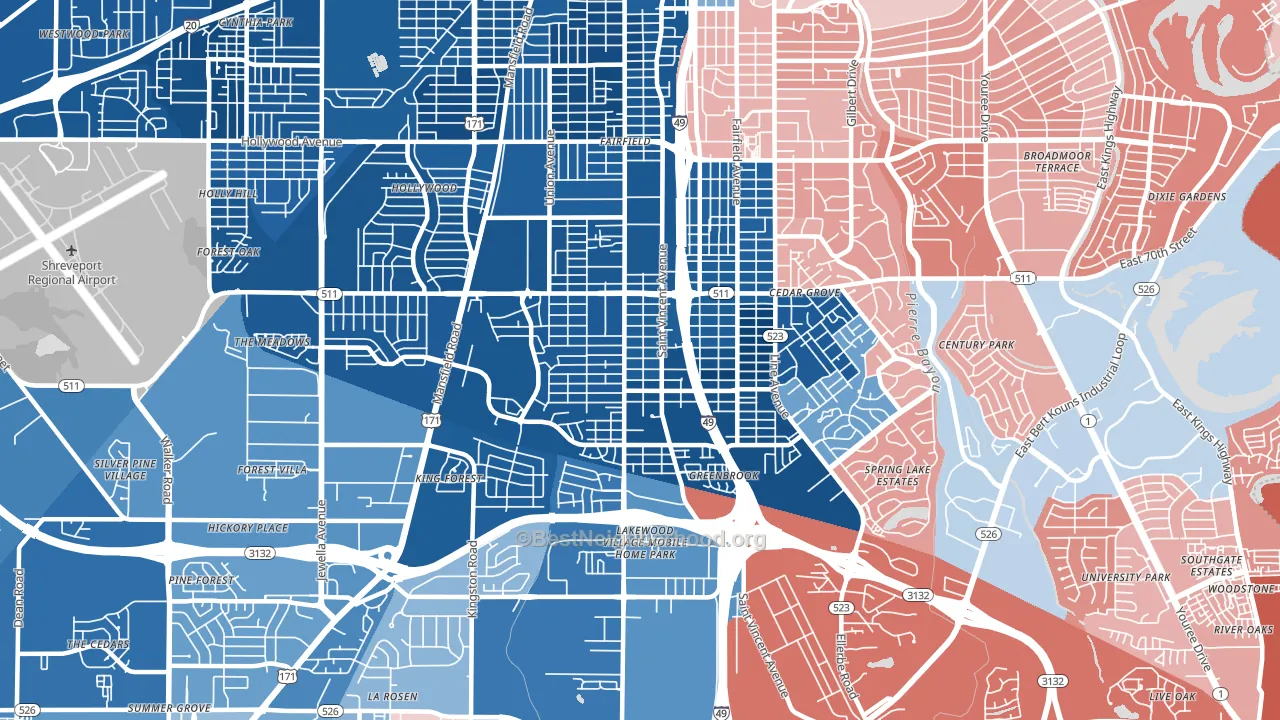
Ceder Grove-Lynbrook is a Democratic stronghold. About 90% of voters here vote Democratic and 10% Republican.
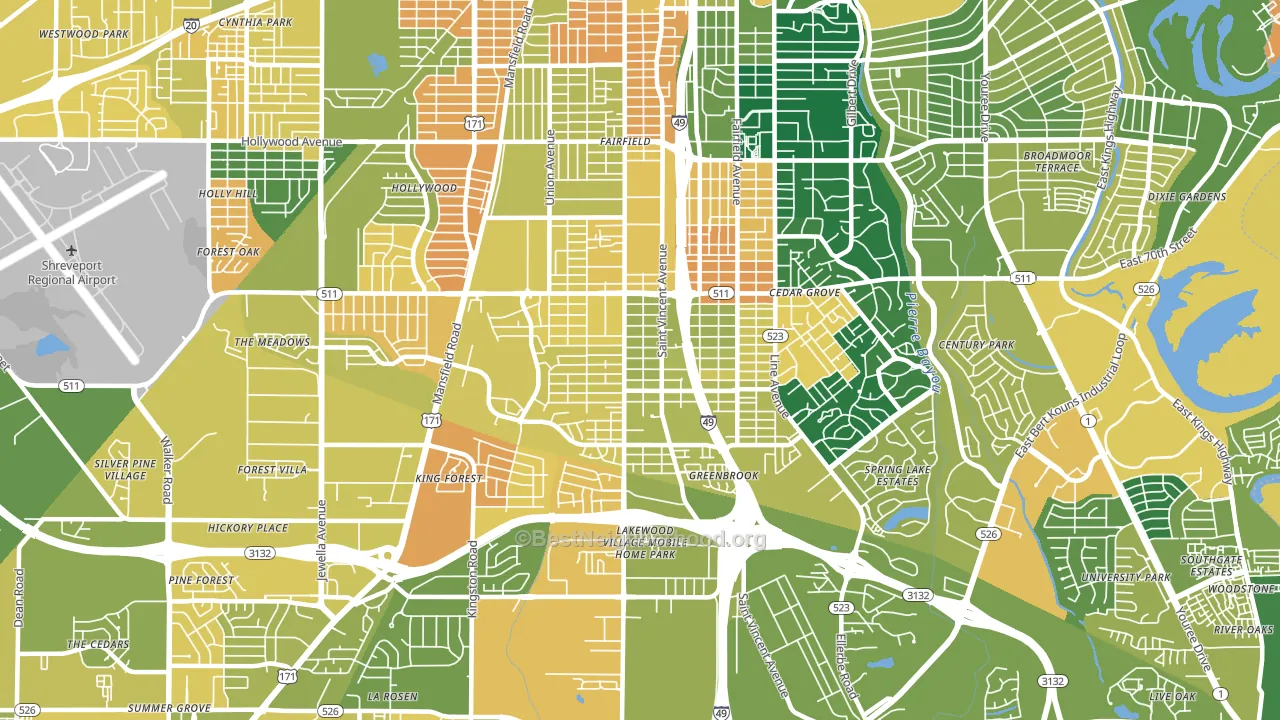
About 54% of adults in Ceder Grove-Lynbrook typically vote, below the U.S. average of about 62%. Among adults in Ceder Grove-Lynbrook, ~49% vote Democratic, ~5% Republican, and ~46% don't vote. The map below shows estimated turnout by block group.
How Ceder Grove-Lynbrook compares
Among neighborhoods within 5 miles, Ceder Grove-Lynbrook leans more Democratic than 8 of 11 neighbors.
Ceder Grove-Lynbrook runs about 103 points more Democratic than Louisiana as a whole. Louisiana leans Republican overall, while Ceder Grove-Lynbrook is one of the few Democratic-leaning pockets.
Politics vary noticeably by block within Ceder Grove-Lynbrook. The east side is the most Democratic-leaning (D+88) and the south side is the least Democratic-leaning (D+68), a spread of about 20 points.
Why Ceder Grove-Lynbrook leans the way it does
This analysis examined 14,881 data points per neighborhood to find what predicts political lean and turnout. The items below are a few correlations that stood out for Ceder Grove-Lynbrook, not a ranked or complete list of what matters most.
Ceder Grove-Lynbrook votes against the grain of Louisiana. Louisiana leans Republican overall, while Ceder Grove-Lynbrook runs about 103 points more Democratic. A high never-married share predicts Democratic voting, and about 48% of adults in Ceder Grove-Lynbrook have never been married, above 79% of neighborhoods.
Preventive-care access and voter turnout
Places with limited routine preventive-care access tend to turn out at a lower rate; Ceder Grove-Lynbrook, Shreveport, LA sits in the bottom tenth nationally on this measure. Dental visits do not drive turnout; the rate reflects income, insurance, and healthcare access, which line up with who votes.
Why turnout in Ceder Grove-Lynbrook looks the way it does
Areas with high food insecurity turn out at lower rates. About 51% of adults in Ceder Grove-Lynbrook report food insecurity, about 35 points above the U.S. average of 16%. Renters vote less often than owners, and about 70% of households in Ceder Grove-Lynbrook rent, compared to around 50% in nearby neighborhoods. Low high-school completion lines up with lower turnout, and about 78% of adults in Ceder Grove-Lynbrook have completed high school, below 88% of neighborhoods. Learn more about the findings and methodology on the political spectrum map.
Nearby Neighborhoods
- Sunset Arcre-Garden Valley-Morningside, Shreveport, LA D+80
- Caddo Heights-South Highlands, Shreveport, LA D+31
- Springlake-University Terrace, Shreveport, LA R+12
- Hyde Park-Brookwood-Southern Hills, Shreveport, LA D+26
- Mooretown and Hollywood Heights, Shreveport, LA D+90
- Queensborough, Shreveport, LA D+84
- Broadmoor-Anderson Isle-Shreve Isle, Shreveport, LA R+7
- Highland-Stoner Hill, Shreveport, LA D+39
- Jenkins-Pinecroft, Shreveport, LA D+33
- Country Club Hills Lakeshore Shops, Shreveport, LA D+79
Neighborhoods with Similar Populations
- Lower Roseville, Newark, NJ D+48
- Trinity-Houston Gardens, Houston, TX D+71
- Lake Nona, Orlando, FL R+4
- Jackson Triangle, Hayward, CA D+38
- West A, Lincoln, NE D+2
- Sulphur Springs, Tampa, FL D+43
- Bevo Mill, St. Louis, MO D+40
- West End, Billings, MT R+20
- Tall Timbers, New Orleans, LA D+65
- North Hayward, Hayward, CA D+42
Sources and methodology
Precinct-level voting records used to fit the model come from Louisiana Secretary of State, Elections, distributed by the Voting and Election Science Team. Demographic inputs come from the U.S. Census Bureau (ACS 5-year estimates and the 2020 Decennial Census). Health and environmental inputs come from the CDC (PLACES and the Environmental Justice Index). Land cover comes from the USGS and EPA. Election-day and lead-up weather come from PRISM 4km daily grids and the NOAA Global Historical Climatology Network. Mail-voting and election-administration patterns come from the MIT Election Lab's Survey of the Performance of American Elections. Block-group crime detail comes from CrimeGrade. Internet data and modeling support provided by ISPreports.org.
Modeling and analysis by the BestNeighborhood data science team. Full methodology and findings: political spectrum map.
Methodology reviewed by the BestNeighborhood data team. Last updated May 2026.