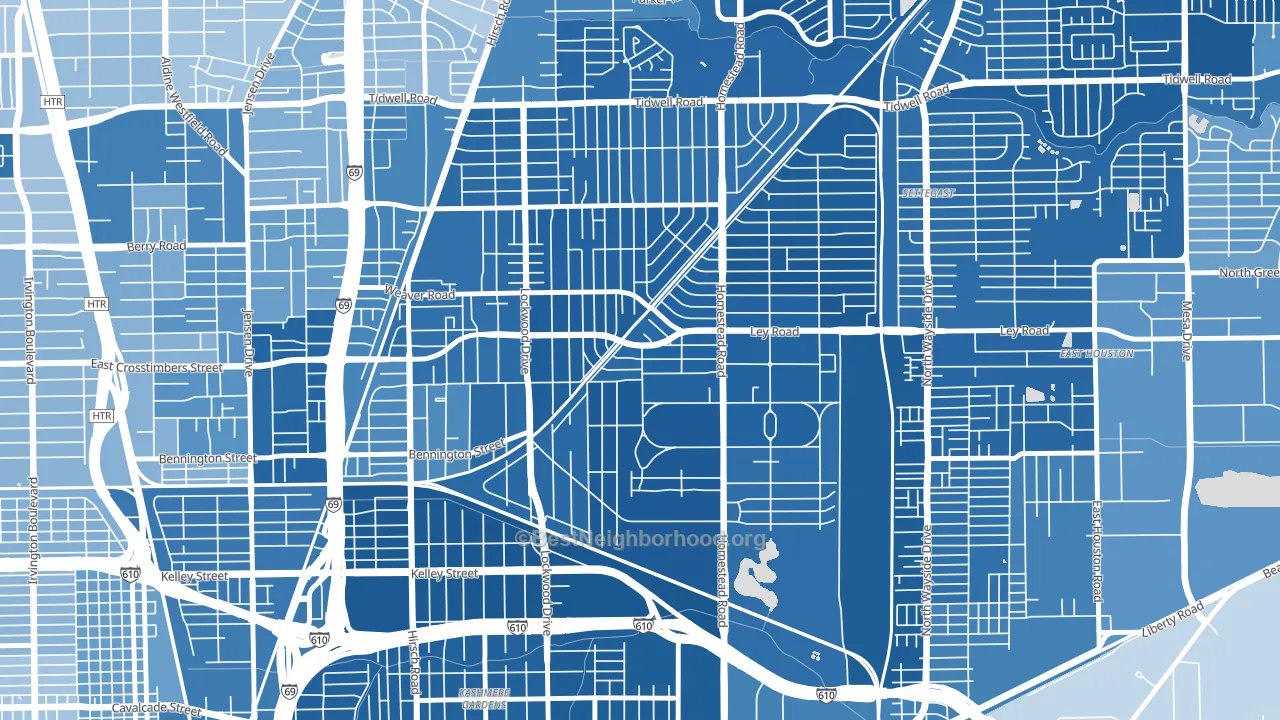
Trinity-Houston Gardens is a Democratic stronghold. About 85% of voters here vote Democratic and 15% Republican.
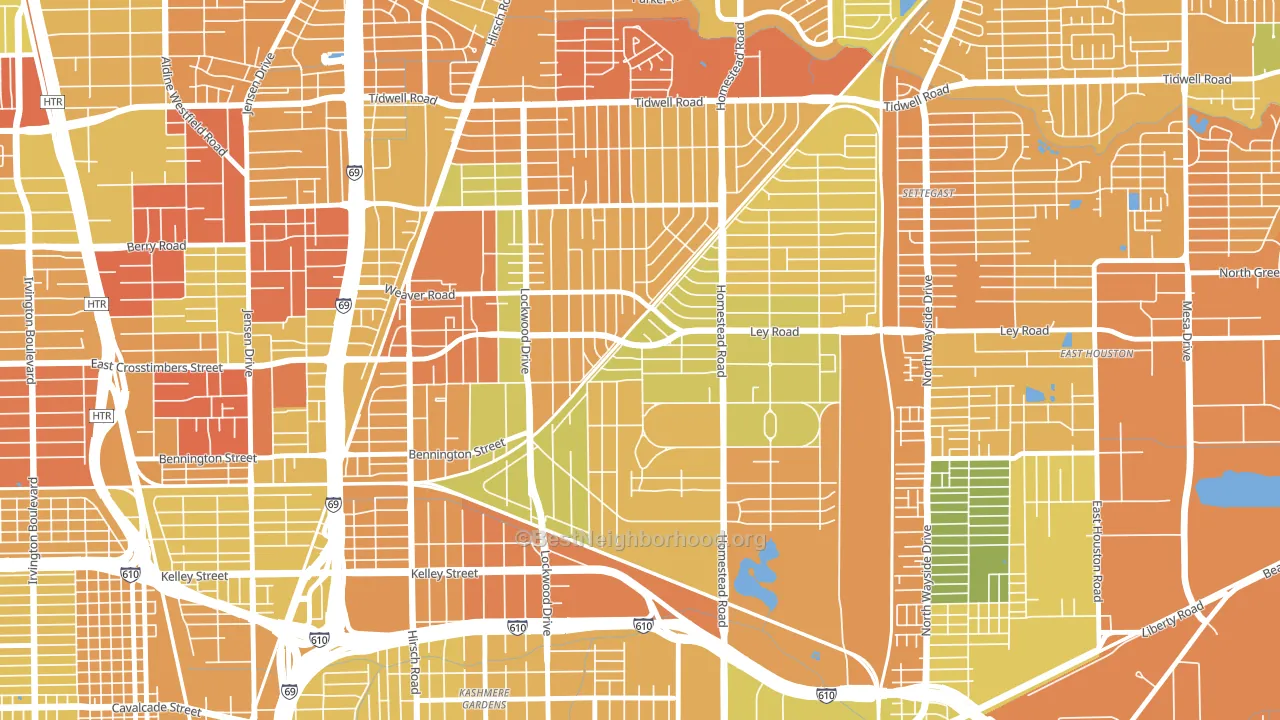
About 39% of adults in Trinity-Houston Gardens typically vote, below the U.S. average of about 62%. Among adults in Trinity-Houston Gardens, ~33% vote Democratic, ~6% Republican, and ~61% don't vote. The map below shows estimated turnout by block group.
How Trinity-Houston Gardens compares
Among neighborhoods within 5 miles, Trinity-Houston Gardens is the most Democratic-leaning.
Trinity-Houston Gardens runs about 84 points more Democratic than Texas as a whole. Texas leans Republican overall, while Trinity-Houston Gardens is one of the few Democratic-leaning pockets.
Politics vary noticeably by block within Trinity-Houston Gardens. The southwest side is the most Democratic-leaning (D+75) and the west side is the least Democratic-leaning (D+63), a spread of about 12 points.
Why Trinity-Houston Gardens leans the way it does
This analysis examined 14,881 data points per neighborhood to find what predicts political lean and turnout. The items below are a few correlations that stood out for Trinity-Houston Gardens, not a ranked or complete list of what matters most.
Trinity-Houston Gardens votes against the grain of Texas. Texas leans Republican overall, while Trinity-Houston Gardens runs about 84 points more Democratic. A high never-married share predicts Democratic voting, and about 50% of adults in Trinity-Houston Gardens have never been married, above 81% of neighborhoods.
Cancer-screening access and voter turnout
Places with low colon-cancer-screening access tend to turn out at a lower rate; Trinity-Houston Gardens, Houston, TX sits in the bottom tenth nationally on this measure. Cancer screening does not drive turnout; it reflects income, insurance, and healthcare access.
Why turnout in Trinity-Houston Gardens looks the way it does
Areas with limited routine healthcare access turn out at lower rates. Trinity-Houston Gardens is in the bottom quarter nationally for routine-care measures such as insurance coverage, preventive screenings, and dental visits. The dental-visit rate here is about 37%, about 16 points below the Texas average of 54%. Low high-school completion lines up with lower turnout, and about 71% of adults in Trinity-Houston Gardens have completed high school, below 94% of neighborhoods. Learn more about the findings and methodology on the political spectrum map.
Nearby Neighborhoods
- Kashmere Gardens, Houston, TX D+70
- East Houston, Houston, TX D+58
- East Little York-Homestead, Houston, TX D+65
- Denver Harbor-Port Houston, Houston, TX D+29
- North, Houston, TX D+26
- Greater Fifth Ward, Houston, TX D+63
- Independence Heights, Houston, TX D+53
- Downtown Houston, Houston, TX D+49
- Northside Northline, Houston, TX D+32
- Downtown Jacinto City, Jacinto City, TX D+9
Neighborhoods with Similar Populations
- Lake Nona, Orlando, FL R+4
- Ceder Grove-Lynbrook, Shreveport, LA D+81
- Jackson Triangle, Hayward, CA D+38
- Lower Roseville, Newark, NJ D+48
- Sulphur Springs, Tampa, FL D+43
- Bevo Mill, St. Louis, MO D+40
- West End, Billings, MT R+20
- West A, Lincoln, NE D+2
- West Henderson, Henderson, NV Even
- Kelvyn Grove, Chicago, IL D+35
Sources and methodology
Precinct-level voting records used to fit the model come from Texas Secretary of State, Elections Division, distributed by the Voting and Election Science Team. Demographic inputs come from the U.S. Census Bureau (ACS 5-year estimates and the 2020 Decennial Census). Health and environmental inputs come from the CDC (PLACES and the Environmental Justice Index). Land cover comes from the USGS and EPA. Election-day and lead-up weather come from PRISM 4km daily grids and the NOAA Global Historical Climatology Network. Mail-voting and election-administration patterns come from the MIT Election Lab's Survey of the Performance of American Elections. Block-group crime detail comes from CrimeGrade. Internet data and modeling support provided by ISPreports.org.
Modeling and analysis by the BestNeighborhood data science team. Full methodology and findings: political spectrum map.
Methodology reviewed by the BestNeighborhood data team. Last updated May 2026.