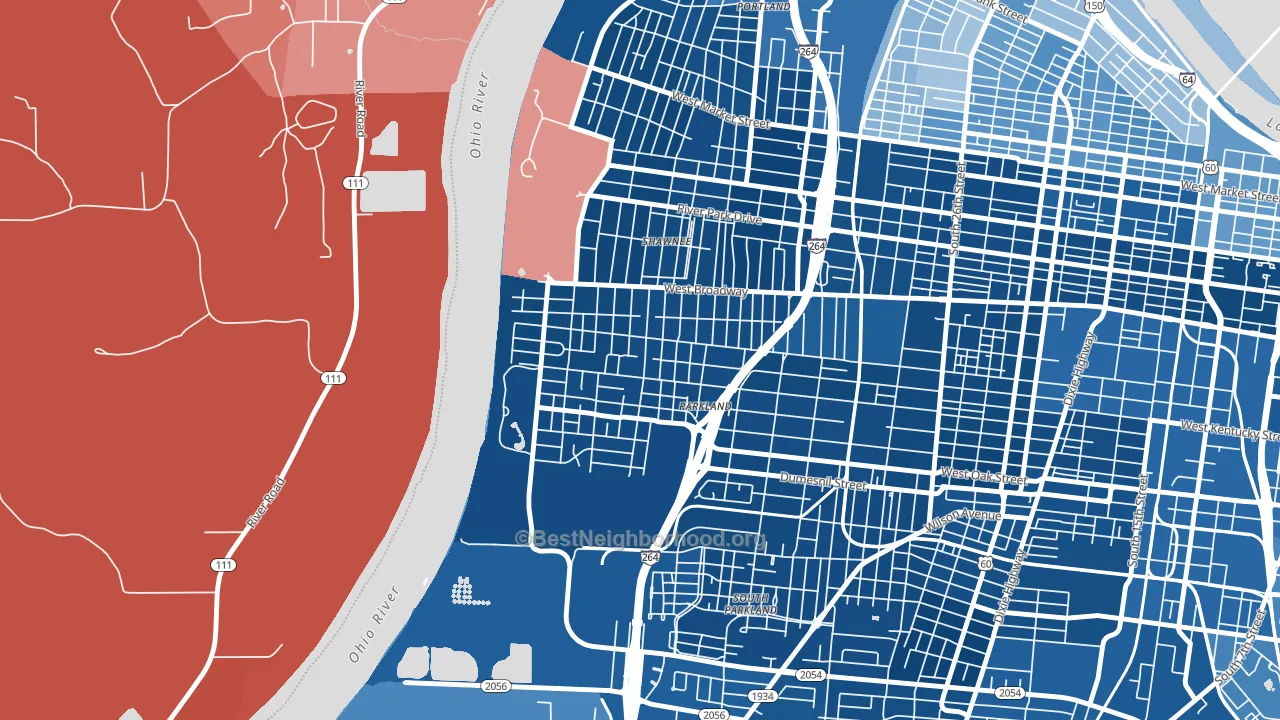
Chickasaw is a Democratic stronghold. About 95% of voters here vote Democratic and 5% Republican.
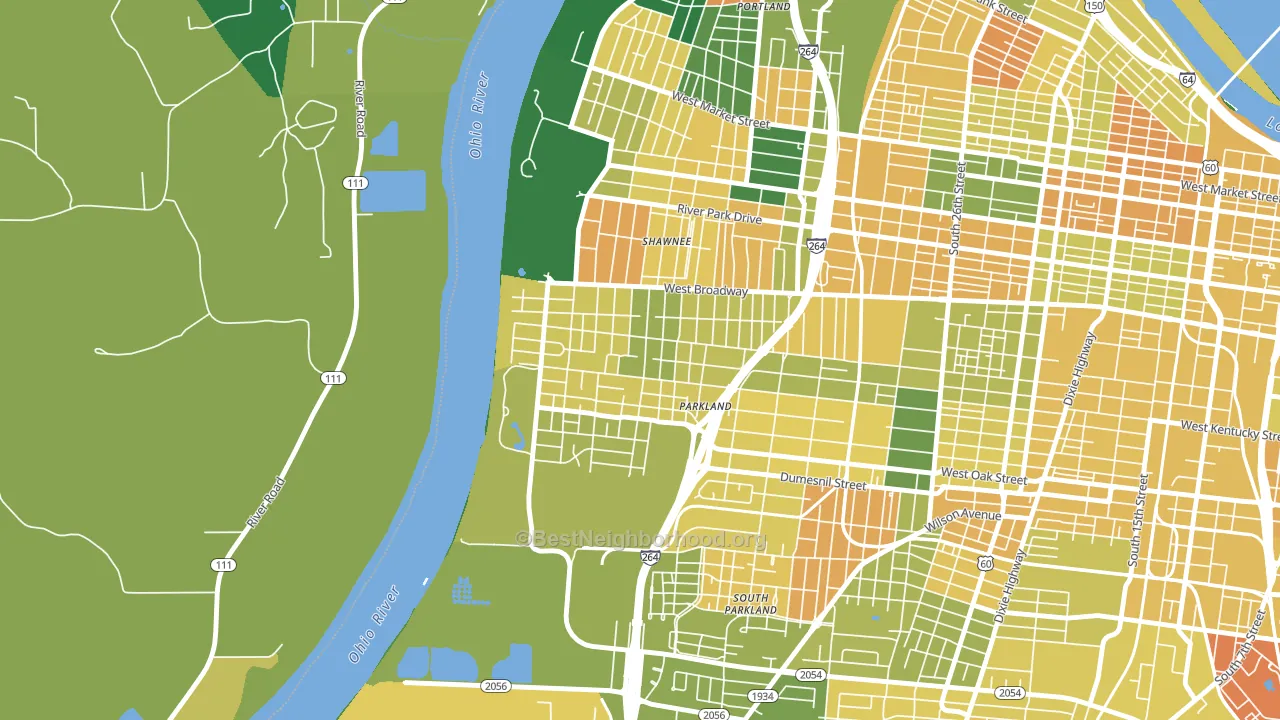
About 60% of adults in Chickasaw typically vote, near the U.S. average of about 62%. Among adults in Chickasaw, ~57% vote Democratic, ~3% Republican, and ~40% don't vote. The map below shows estimated turnout by block group.
How Chickasaw compares
Among neighborhoods within 5 miles, Chickasaw leans more Democratic than 19 of 20 neighbors.
Chickasaw runs about 120 points more Democratic than Kentucky as a whole. Kentucky leans Republican overall, while Chickasaw is one of the few Democratic-leaning pockets.
Why Chickasaw leans the way it does
This analysis examined 14,881 data points per neighborhood to find what predicts political lean and turnout. The items below are a few correlations that stood out for Chickasaw, not a ranked or complete list of what matters most.
Chickasaw votes against the grain of Kentucky. Kentucky leans Republican overall, while Chickasaw runs about 120 points more Democratic. A high never-married share predicts Democratic voting, and about 50% of adults in Chickasaw have never been married, above 82% of neighborhoods.
High-school completion, developed land, and voter turnout
Places that combine low high-school-completion share and a heavily developed built environment tend to turn out at a lower rate, as Chickasaw, Louisville, KY does.
Why turnout in Chickasaw looks the way it does
Areas with low high-school completion turn out at lower rates. About 80% of adults in Chickasaw have completed high school, about 10 points below the U.S. average of 90%. High-crime urban areas turn out at lower rates, and Chickasaw sits in the top 15% on a violent-crime measure. Learn more about the findings and methodology on the political spectrum map.
Nearby Neighborhoods
- Parkland, Louisville, KY D+90
- Shawnee, Louisville, KY D+86
- Park Duvalle, Louisville, KY D+88
- California, Louisville, KY D+86
- Park Hill, Louisville, KY D+84
- Russell, Louisville, KY D+82
- Portland, Louisville, KY D+29
- Algonquin, Louisville, KY D+72
- Taylor Berry, Louisville, KY D+43
- Central Business District, Louisville, KY D+58
Neighborhoods with Similar Populations
- Idlewild Farms, Charlotte, NC D+55
- Del Paso Heights, Sacramento, CA D+38
- West Lake Forest, New Orleans, LA D+85
- Camellia Gardens, Orlando, FL D+57
- Parkside, Hollywood, FL D+19
- Townelake, Sayreville, NJ R+11
- Auburn Park, Chicago, IL D+82
- McKinley Mitchell, Tulsa, OK D+11
- Bingham, Springfield, MO R+3
- Berkshire Lakes, Naples, FL R+15
Sources and methodology
Precinct-level voting records used to fit the model come from Kentucky State Board of Elections, distributed by the Voting and Election Science Team. Demographic inputs come from the U.S. Census Bureau (ACS 5-year estimates and the 2020 Decennial Census). Health and environmental inputs come from the CDC (PLACES and the Environmental Justice Index). Land cover comes from the USGS and EPA. Election-day and lead-up weather come from PRISM 4km daily grids and the NOAA Global Historical Climatology Network. Mail-voting and election-administration patterns come from the MIT Election Lab's Survey of the Performance of American Elections. Block-group crime detail comes from CrimeGrade. Internet data and modeling support provided by ISPreports.org.
Modeling and analysis by the BestNeighborhood data science team. Full methodology and findings: political spectrum map.
Methodology reviewed by the BestNeighborhood data team. Last updated May 2026.