West Lake Forest is a Democratic stronghold. About 93% of voters here vote Democratic and 7% Republican.
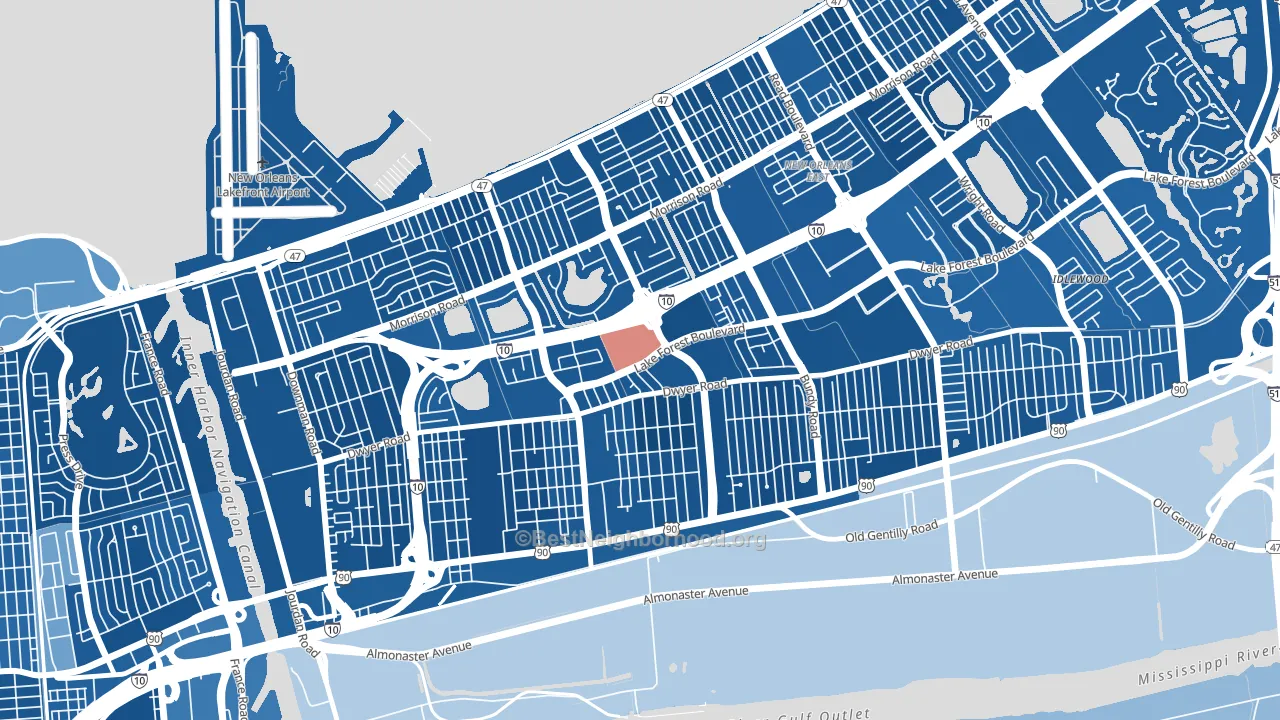
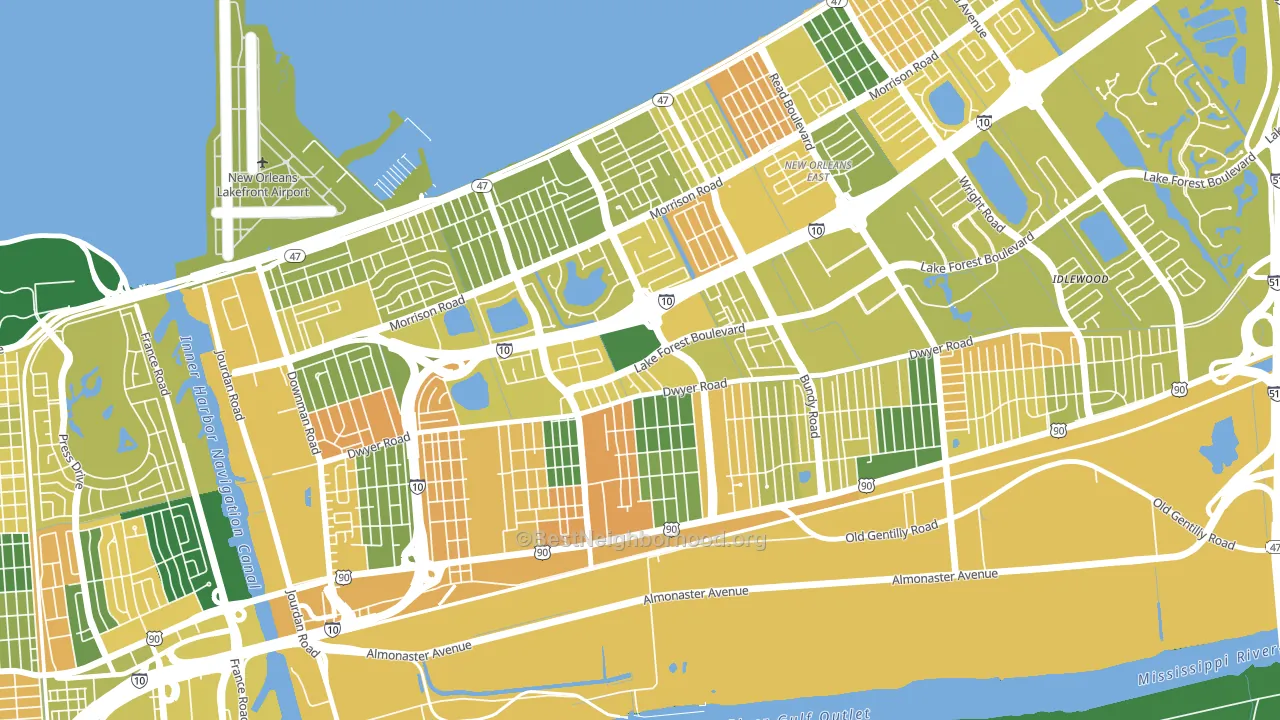
About 50% of adults in West Lake Forest typically vote, below the U.S. average of about 62%. Among adults in West Lake Forest, ~47% vote Democratic, ~3% Republican, and ~50% don't vote. The map below shows estimated turnout by block group.
How West Lake Forest compares
Among neighborhoods within 5 miles, West Lake Forest leans more Democratic than 14 of 16 neighbors.
West Lake Forest runs about 107 points more Democratic than Louisiana as a whole. Louisiana leans Republican overall, while West Lake Forest is one of the few Democratic-leaning pockets.
Why West Lake Forest leans the way it does
This analysis examined 14,881 data points per neighborhood to find what predicts political lean and turnout. The items below are a few correlations that stood out for West Lake Forest, not a ranked or complete list of what matters most.
West Lake Forest votes against the grain of Louisiana. Louisiana leans Republican overall, while West Lake Forest runs about 107 points more Democratic. A high never-married share predicts Democratic voting, and about 62% of adults in West Lake Forest have never been married, above 94% of neighborhoods.
Walkability and Democratic lean
Places with a highly walkable street grid tend to lean Democratic; West Lake Forest, New Orleans, LA sits in the top quarter nationally on this measure. A walkable street grid does not change how people vote; it mostly reflects how urban a place is.
Why turnout in West Lake Forest looks the way it does
Areas with high food insecurity turn out at lower rates. About 43% of adults in West Lake Forest report food insecurity, about 27 points above the U.S. average of 16%. Renters vote less often than owners, and about 68% of households in West Lake Forest rent, compared to around 38% in nearby neighborhoods. Learn more about the findings and methodology on the political spectrum map.
Nearby Neighborhoods
- Plum Orchard, New Orleans, LA D+84
- Read Blvd West, New Orleans, LA D+87
- Pines Village, New Orleans, LA D+87
- Little Woods, New Orleans, LA D+83
- Read Blvd East, New Orleans, LA D+80
- Gentilly Woods, New Orleans, LA D+73
- Milneburg, New Orleans, LA D+77
- Gentilly Terrace, New Orleans, LA D+75
- Lower 9th Ward, New Orleans, LA D+80
- Saint Anthony, New Orleans, LA D+72
Neighborhoods with Similar Populations
- Camellia Gardens, Orlando, FL D+57
- Townelake, Sayreville, NJ R+11
- Idlewild Farms, Charlotte, NC D+55
- Chickasaw, Louisville, KY D+89
- Auburn Park, Chicago, IL D+82
- McKinley Mitchell, Tulsa, OK D+11
- Del Paso Heights, Sacramento, CA D+38
- Parkside, Hollywood, FL D+19
- Brandywine Village, Wilmington, DE D+79
- Tom Watkins, Springfield, MO R+22
Sources and methodology
Precinct-level voting records used to fit the model come from Louisiana Secretary of State, Elections, distributed by the Voting and Election Science Team. Demographic inputs come from the U.S. Census Bureau (ACS 5-year estimates and the 2020 Decennial Census). Health and environmental inputs come from the CDC (PLACES and the Environmental Justice Index). Land cover comes from the USGS and EPA. Election-day and lead-up weather come from PRISM 4km daily grids and the NOAA Global Historical Climatology Network. Mail-voting and election-administration patterns come from the MIT Election Lab's Survey of the Performance of American Elections. Block-group crime detail comes from CrimeGrade. Internet data and modeling support provided by ISPreports.org.
Modeling and analysis by the BestNeighborhood data science team. Full methodology and findings: political spectrum map.
Methodology reviewed by the BestNeighborhood data team. Last updated May 2026.