Crowfoot leans Republican by roughly 22 points: about 39% of voters vote Democratic and 61% Republican.
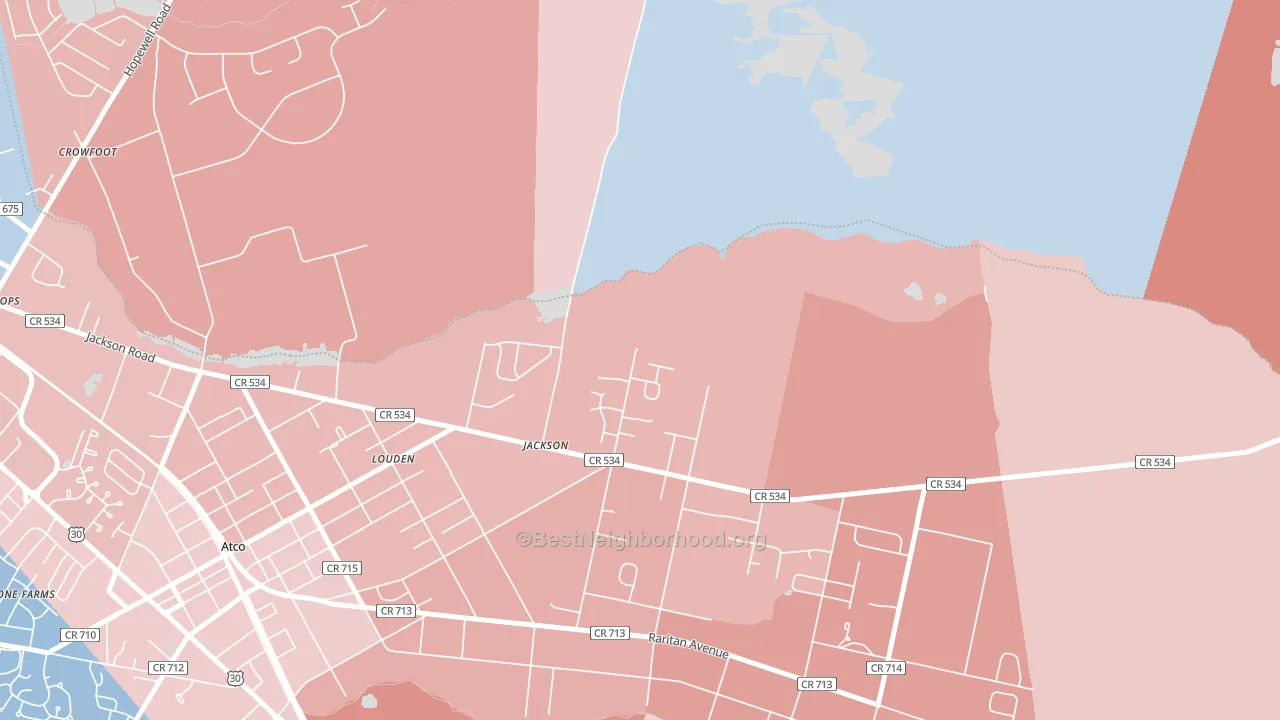
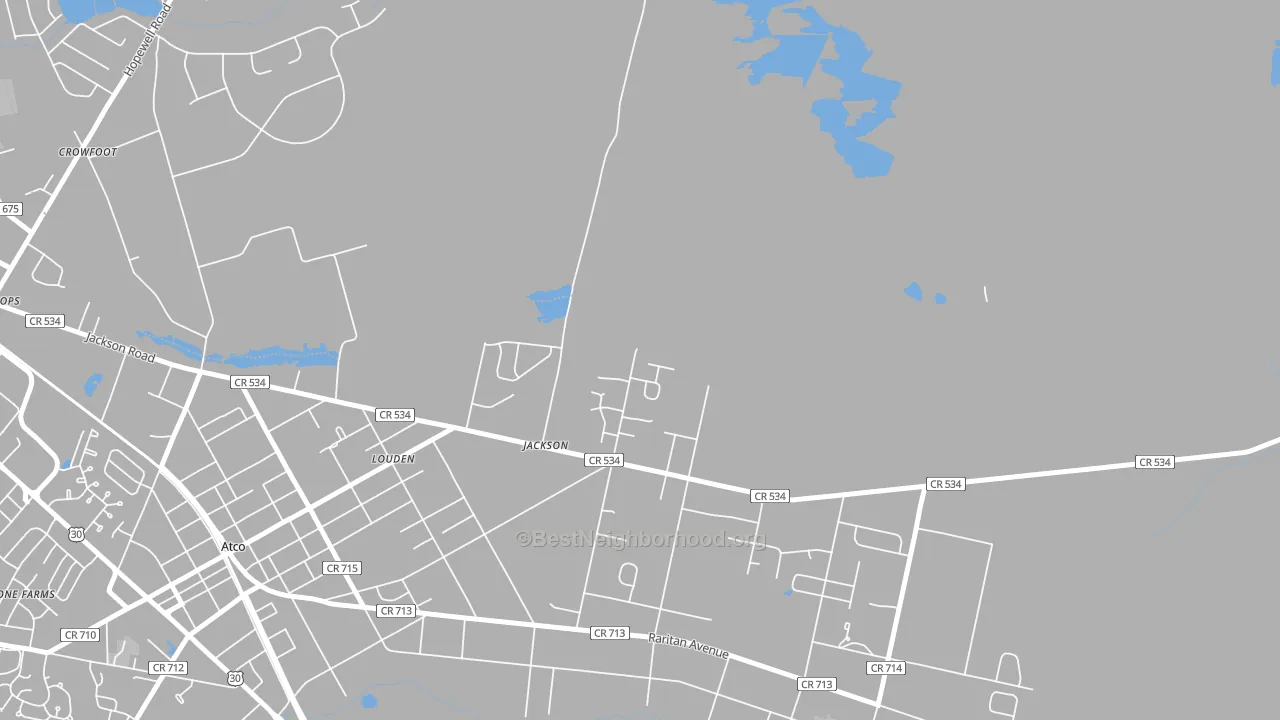
About 80% of adults in Crowfoot typically vote, above the U.S. average of about 62%. Among adults in Crowfoot, ~31% vote Democratic, ~49% Republican, and ~20% don't vote. The map below shows estimated turnout by block group.
How Crowfoot compares
Among cities within 25 miles, Crowfoot leans more Republican than 136 of 176 neighbors.
Crowfoot runs about 28 points more Republican than New Jersey as a whole. New Jersey leans Democratic overall, while Crowfoot is one of the few Republican-leaning pockets.
Why Crowfoot leans the way it does
This analysis examined 14,881 data points per city to find what predicts political lean and turnout. The items below are a few correlations that stood out for Crowfoot, not a ranked or complete list of what matters most.
Crowfoot votes Republican even though it is densely developed (about 23%, far below the New Jersey average of 63%). State and regional patterns outweigh the Democratic lean that density usually predicts here. A high family-household share predicts Republican voting, and about 82% of households in Crowfoot are family households, above 93% of cities. Crowfoot runs against the grain of New Jersey, a Republican-leaning pocket in a Democratic-leaning state.
Homeownership and voter turnout
Places with homeowner-heavy households tend to turn out at a higher rate; Crowfoot, NJ sits in the top tenth nationally on this measure.
Why turnout in Crowfoot looks the way it does
Homeowners vote more often than renters. More than 99% of households in Crowfoot own their home, about 26 points above the New Jersey average of 74%. High high-school completion lines up with higher turnout, and about 97% of adults in Crowfoot have completed high school, above 89% of cities. Learn more about the findings and methodology on the political spectrum map.
Nearby Cities
- Atco, NJ R+8
- Chesilhurst, NJ D+24
- Waterford Works, NJ R+22
- Berlin, NJ R+3
- West Berlin, NJ Even
- Medford Lakes, NJ D+3
- Indian Mills, NJ R+31
- Elm, NJ R+38
- Pine Valley, NJ Even
- Voorhees, NJ D+25
Cities with Similar Populations
- Carson, ND R+72
- Foster Pond, IL R+50
- Sandstone, WV R+54
- Perrytown, AR R+55
- Brussels, IL R+53
- Mutual, OK R+79
- Wyodak, WY R+81
- Ladoga, WI R+48
- Grand Mound, WA R+31
- Carlisle, NY R+45
Sources and methodology
Precinct-level voting records used to fit the model come from New Jersey Division of Elections, distributed by the Voting and Election Science Team. Demographic inputs come from the U.S. Census Bureau (ACS 5-year estimates and the 2020 Decennial Census). Health and environmental inputs come from the CDC (PLACES and the Environmental Justice Index). Land cover comes from the USGS and EPA. Election-day and lead-up weather come from PRISM 4km daily grids and the NOAA Global Historical Climatology Network. Mail-voting and election-administration patterns come from the MIT Election Lab's Survey of the Performance of American Elections. Block-group crime detail comes from CrimeGrade. Internet data and modeling support provided by ISPreports.org.
Modeling and analysis by the BestNeighborhood data science team. Full methodology and findings: political spectrum map.
Methodology reviewed by the BestNeighborhood data team. Last updated May 2026.