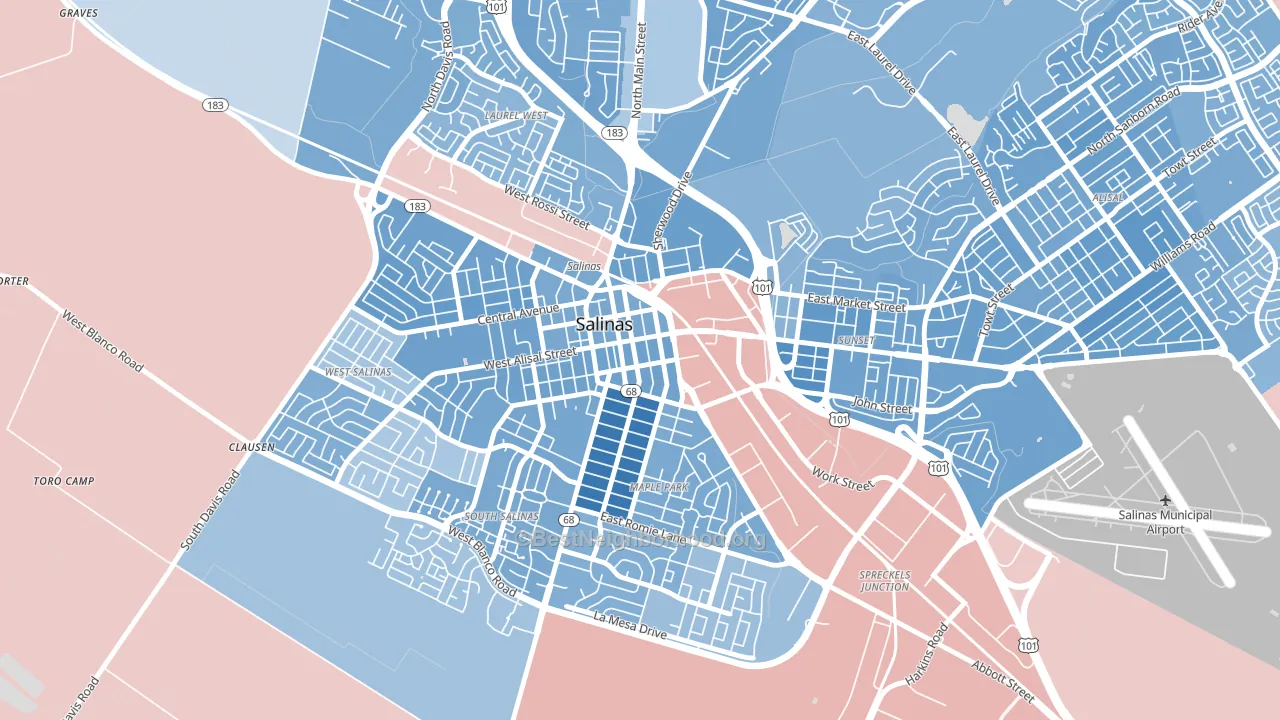
Downtown Salinas leans heavily Democratic by roughly 32 points: about 66% of voters vote Democratic and 34% Republican.
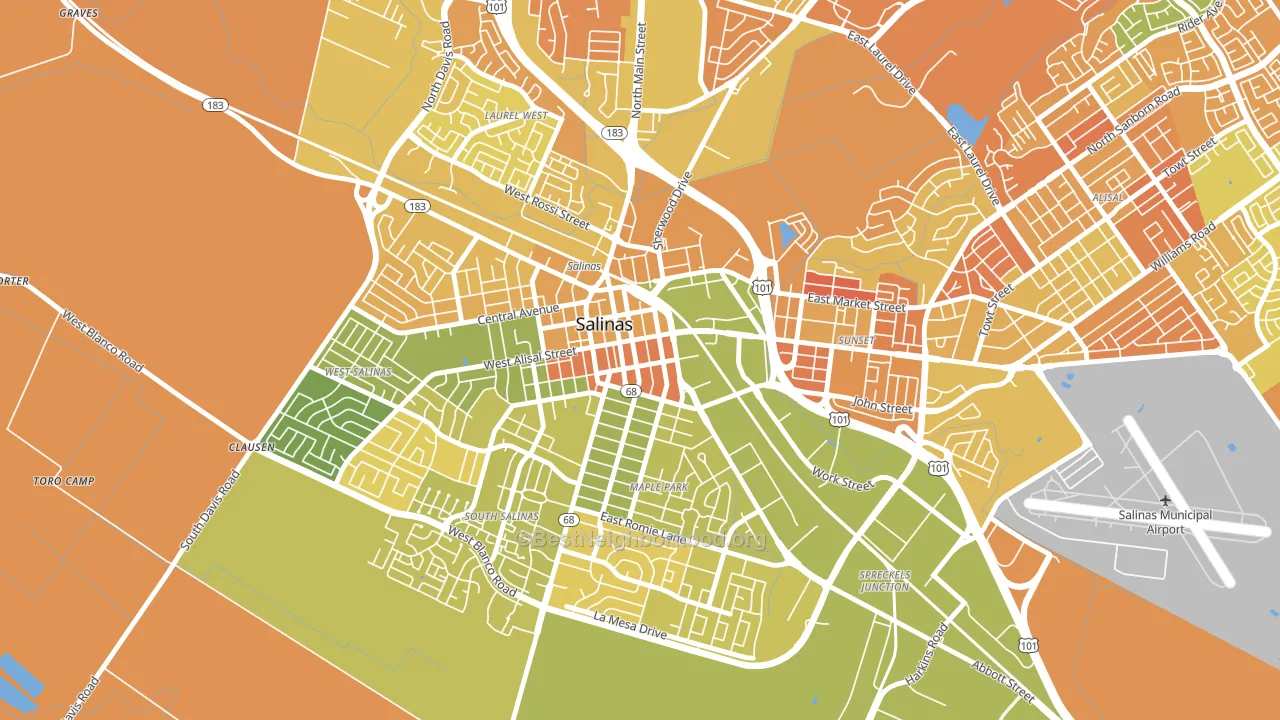
About 41% of adults in Downtown Salinas typically vote, below the U.S. average of about 62%. Among adults in Downtown Salinas, ~27% vote Democratic, ~14% Republican, and ~59% don't vote. The map below shows estimated turnout by block group.
How Downtown Salinas compares
Downtown Salinas runs about 13 points more Democratic than California as a whole.
Politics vary noticeably by block within Downtown Salinas. The southwest side is the most Democratic-leaning (D+40) and the east side is the least Democratic-leaning (D+22), a spread of about 18 points.
Why Downtown Salinas leans the way it does
This analysis examined 14,881 data points per neighborhood to find what predicts political lean and turnout. The items below are a few correlations that stood out for Downtown Salinas, not a ranked or complete list of what matters most.
Areas with many never-married adults vote Democratic. About 46% of adults in Downtown Salinas have never been married, about 17 points above the U.S. average of 29%.
Walkability and Democratic lean
Places with a highly walkable street grid tend to lean Democratic; Downtown Salinas, Salinas, CA sits in the top tenth nationally on this measure. A walkable street grid does not change how people vote; it mostly reflects how urban a place is.
Why turnout in Downtown Salinas looks the way it does
Areas with limited routine healthcare access turn out at lower rates. Downtown Salinas is in the bottom quarter nationally for routine-care measures such as insurance coverage, preventive screenings, and dental visits. Renters vote less often than owners, and about 74% of households in Downtown Salinas rent, compared to around 38% in nearby neighborhoods. Crowded housing lines up with lower turnout, and about 23% of homes in Downtown Salinas have more than one occupant per room, in the top fraction of neighborhoods. Learn more about the findings and methodology on the political spectrum map.
Nearby Neighborhoods
- Live Oak, Santa Cruz, CA D+50
- Central Santa Cruz, Santa Cruz, CA D+65
- Westside, Santa Cruz, CA D+73
- Santa Teresa, San Jose, CA D+26
- Almaden Valley, San Jose, CA D+27
- Blossom Valley, San Jose, CA D+25
- Edenvale-Seven Trees, San Jose, CA D+28
- Cambrian Park, San Jose, CA D+28
- Garden-Villa Montery, San Jose, CA D+33
- Evergreen, San Jose, CA D+22
Neighborhoods with Similar Populations
- Lind-Bohanon, Minneapolis, MN D+56
- Riviera East, Houston, TX D+50
- Glenbrook, Columbus, OH D+60
- Baden, St. Louis, MO D+83
- North Elevation, Billings, MT D+7
- Juneau Town, Milwaukee, WI D+48
- Columbia Heghts, Arlington, VA D+61
- Horseshoe Park, Aurora, CO D+24
- Leaksville, Eden, NC R+9
- Northwest Arvada, Arvada, CO D+16
Sources and methodology
Precinct-level voting records used to fit the model come from California Secretary of State, Elections, distributed by the Voting and Election Science Team. Demographic inputs come from the U.S. Census Bureau (ACS 5-year estimates and the 2020 Decennial Census). Health and environmental inputs come from the CDC (PLACES and the Environmental Justice Index). Land cover comes from the USGS and EPA. Election-day and lead-up weather come from PRISM 4km daily grids and the NOAA Global Historical Climatology Network. Mail-voting and election-administration patterns come from the MIT Election Lab's Survey of the Performance of American Elections. Block-group crime detail comes from CrimeGrade. Internet data and modeling support provided by ISPreports.org.
Modeling and analysis by the BestNeighborhood data science team. Full methodology and findings: political spectrum map.
Methodology reviewed by the BestNeighborhood data team. Last updated May 2026.