Dunn County is a Republican stronghold. About 24% of voters here vote Democratic and 76% Republican.
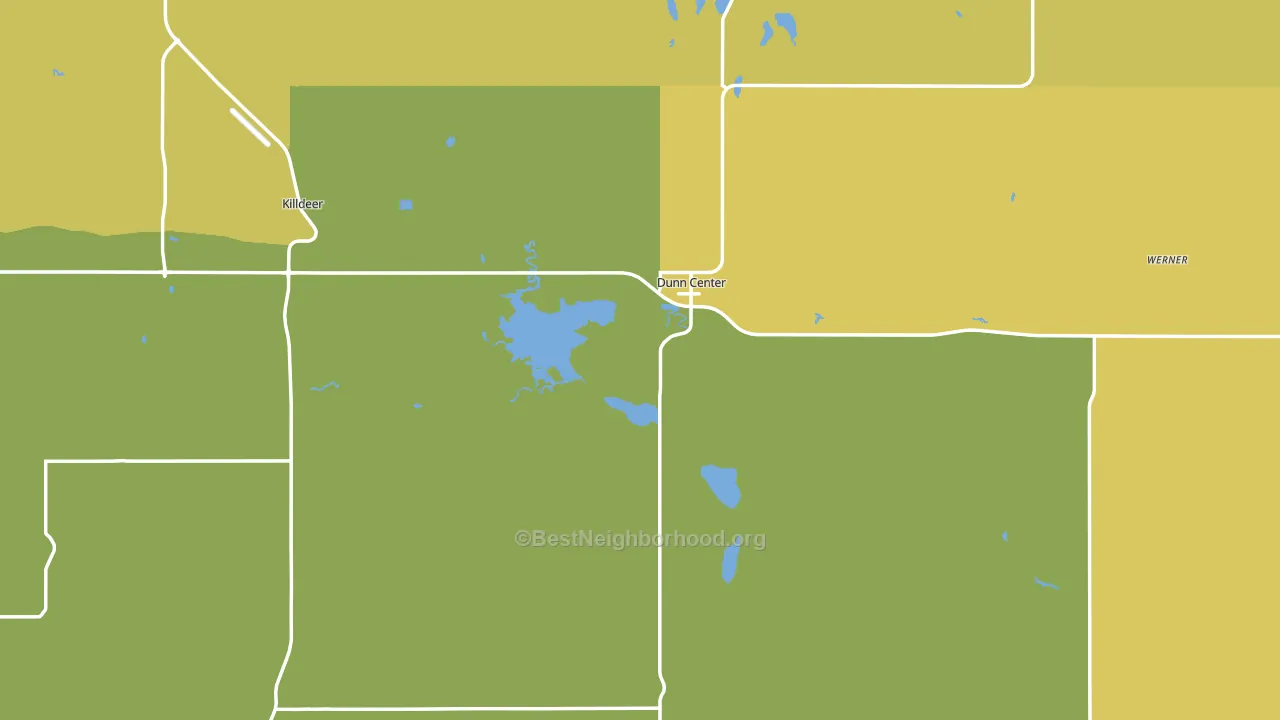
About 61% of adults in Dunn County typically vote, near the U.S. average of about 62%. Among adults in Dunn County, ~15% vote Democratic, ~46% Republican, and ~39% don't vote. The map below shows estimated turnout by block group.
How Dunn County compares
Among counties within 50 miles, Dunn County is the least Republican-leaning.
Dunn County runs about 16 points more Republican than North Dakota as a whole.
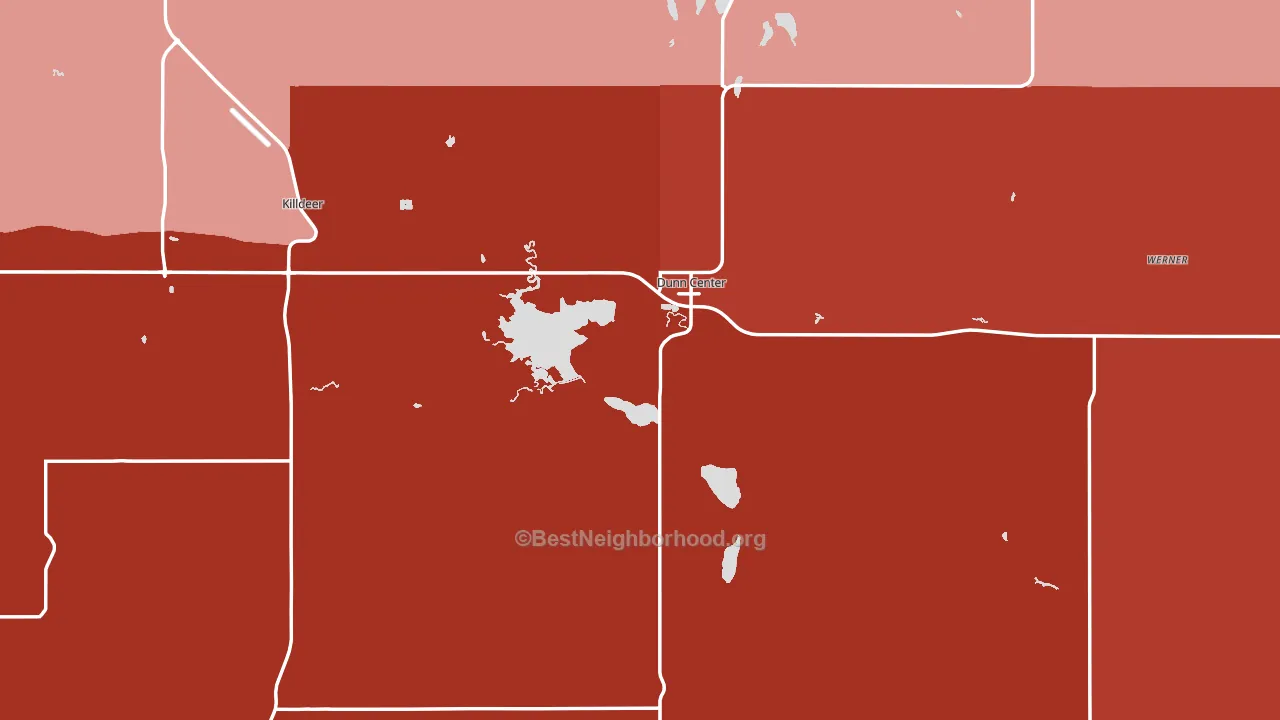
Politics vary noticeably by city within Dunn County. The southwest side is the most Republican-leaning (R+77) and the northeast side is the least Republican-leaning (R+23), a spread of about 54 points.
Why Dunn County leans the way it does
Density, race composition, education, and family structure all sit close to their national averages in Dunn County. The lean here lands roughly where demographic data alone would predict.
Developed land and Republican lean
Places with a rural land-use pattern tend to lean Republican; Dunn County, ND sits in the bottom tenth nationally on this measure. Developed land does not change how people vote; it mostly reflects how urban a place is.
Why turnout in Dunn County looks the way it does
Crowded housing lines up with lower turnout. About 4% of homes in Dunn County have more than one occupant per room, above 84% of counties. Learn more about the findings and methodology on the political spectrum map.
Nearby Counties
- Stark County, ND R+53
- Billings County, ND R+67
- Mercer County, ND R+65
- McKenzie County, ND R+56
- Mountrail County, ND R+35
- Hettinger County, ND R+69
- Oliver County, ND R+67
- McLean County, ND R+51
- Golden Valley County, ND R+69
- Slope County, ND R+74
Counties with Similar Populations
- Nuckolls County, NE R+60
- LaMoure County, ND R+57
- Storey County, NV R+40
- Union County, NM R+52
- Stafford County, KS R+66
- Valley County, NE R+67
- Meade County, KS R+68
- Owsley County, KY R+74
- Tensas Parish, LA R+4
- Schuyler County, MO R+67
Sources and methodology
Precinct-level voting records used to fit the model come from North Dakota Secretary of State, Elections, distributed by the Voting and Election Science Team. Demographic inputs come from the U.S. Census Bureau (ACS 5-year estimates and the 2020 Decennial Census). Health and environmental inputs come from the CDC (PLACES and the Environmental Justice Index). Land cover comes from the USGS and EPA. Election-day and lead-up weather come from PRISM 4km daily grids and the NOAA Global Historical Climatology Network. Mail-voting and election-administration patterns come from the MIT Election Lab's Survey of the Performance of American Elections. Block-group crime detail comes from CrimeGrade. Internet data and modeling support provided by ISPreports.org.
Modeling and analysis by the BestNeighborhood data science team. Full methodology and findings: political spectrum map.
Methodology reviewed by the BestNeighborhood data team. Last updated May 2026.