Echo Park is a Democratic stronghold. About 80% of voters here vote Democratic and 20% Republican.
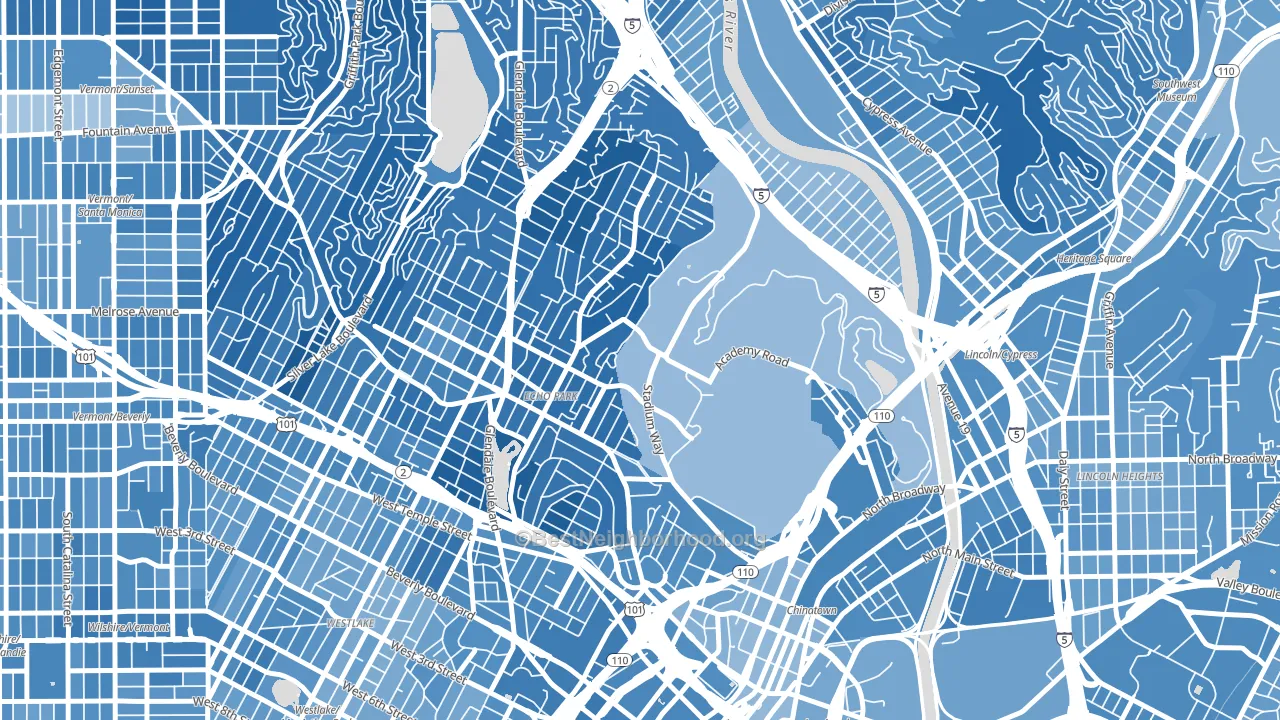
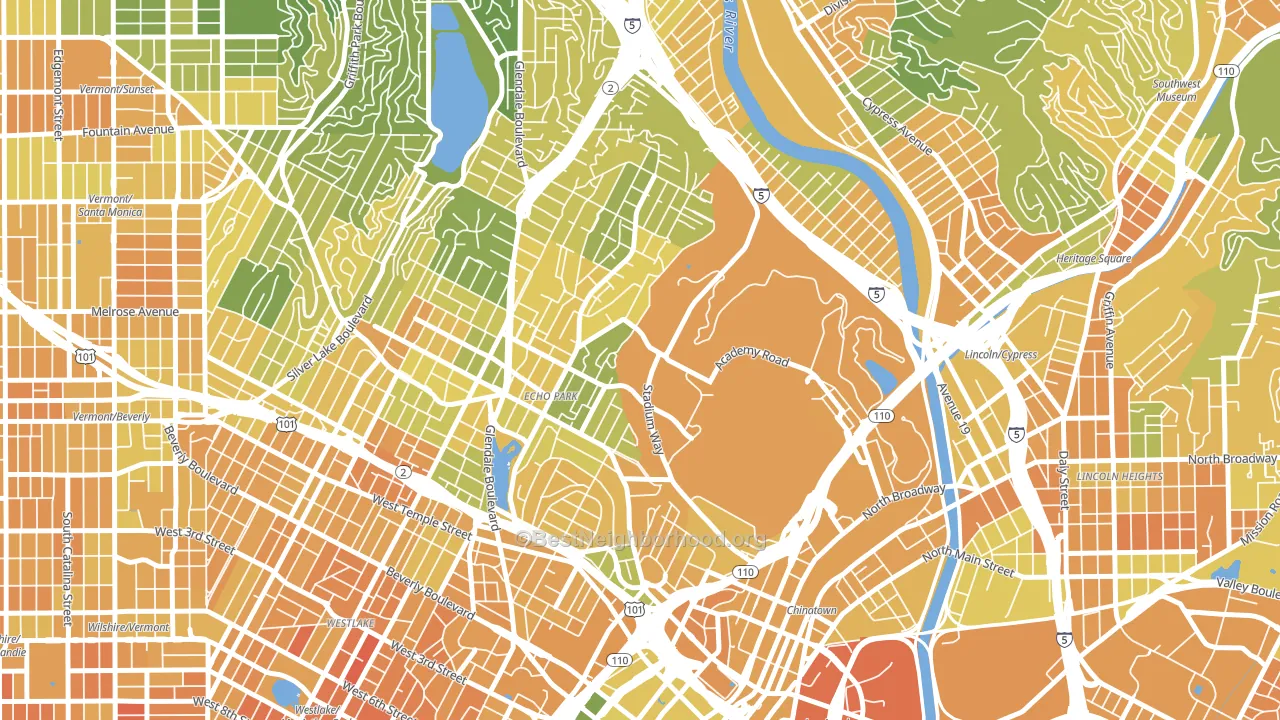
About 47% of adults in Echo Park typically vote, below the U.S. average of about 62%. Among adults in Echo Park, ~38% vote Democratic, ~9% Republican, and ~53% don't vote. The map below shows estimated turnout by block group.
How Echo Park compares
Among neighborhoods within 5 miles, Echo Park leans more Democratic than 31 of 35 neighbors.
Echo Park runs about 40 points more Democratic than California as a whole.
Politics vary noticeably by block within Echo Park. The southwest side is the most Democratic-leaning (D+70) and the east side is the least Democratic-leaning (D+42), a spread of about 28 points.
Why Echo Park leans the way it does
This analysis examined 14,881 data points per neighborhood to find what predicts political lean and turnout. The items below are a few correlations that stood out for Echo Park, not a ranked or complete list of what matters most.
Areas with many never-married adults vote Democratic. About 55% of adults in Echo Park have never been married, modestly above similar-sized neighborhoods (around 44%).
Walkability and Democratic lean
Places with a highly walkable street grid tend to lean Democratic; Echo Park, Los Angeles, CA sits in the top quarter nationally on this measure. A walkable street grid does not change how people vote; it mostly reflects how urban a place is.
Why turnout in Echo Park looks the way it does
Renters vote less often than owners. About 72% of households in Echo Park rent, about 48 points above the U.S. average of 25%. Crowded housing lines up with lower turnout, and about 9% of homes in Echo Park have more than one occupant per room, above 90% of neighborhoods. Learn more about the findings and methodology on the political spectrum map.
Nearby Neighborhoods
- Silver Lake, Los Angeles, CA D+66
- Chinatown, Los Angeles, CA D+36
- Historic Filipinotown, Los Angeles, CA D+44
- Cypress Park, Los Angeles, CA D+51
- Civic Center Little Tokyo, Los Angeles, CA D+48
- New Downtown, Los Angeles, CA D+54
- Westlake, Los Angeles, CA D+41
- Lincoln Heights, Los Angeles, CA D+53
- Downtown Los Angeles, Los Angeles, CA D+65
- Montecito Heights, Los Angeles, CA D+42
Neighborhoods with Similar Populations
- Westwood, Cincinnati, OH D+46
- South Dallas Fair Park, Dallas, TX D+76
- Belmont, Philadelphia, PA D+85
- La Habra City, La Habra, CA D+7
- Montecito Heights, Los Angeles, CA D+42
- Montebello, Denver, CO D+46
- Juniata Park-Feltonville, Philadelphia, PA D+44
- Millard, Omaha, NE Even
- Los Feliz, Los Angeles, CA D+64
- Eastside Enact, Tacoma, WA D+32
Sources and methodology
Precinct-level voting records used to fit the model come from California Secretary of State, Elections, distributed by the Voting and Election Science Team. Demographic inputs come from the U.S. Census Bureau (ACS 5-year estimates and the 2020 Decennial Census). Health and environmental inputs come from the CDC (PLACES and the Environmental Justice Index). Land cover comes from the USGS and EPA. Election-day and lead-up weather come from PRISM 4km daily grids and the NOAA Global Historical Climatology Network. Mail-voting and election-administration patterns come from the MIT Election Lab's Survey of the Performance of American Elections. Block-group crime detail comes from CrimeGrade. Internet data and modeling support provided by ISPreports.org.
Modeling and analysis by the BestNeighborhood data science team. Full methodology and findings: political spectrum map.
Methodology reviewed by the BestNeighborhood data team. Last updated May 2026.