Emmons County is a Republican stronghold. About 15% of voters here vote Democratic and 85% Republican.
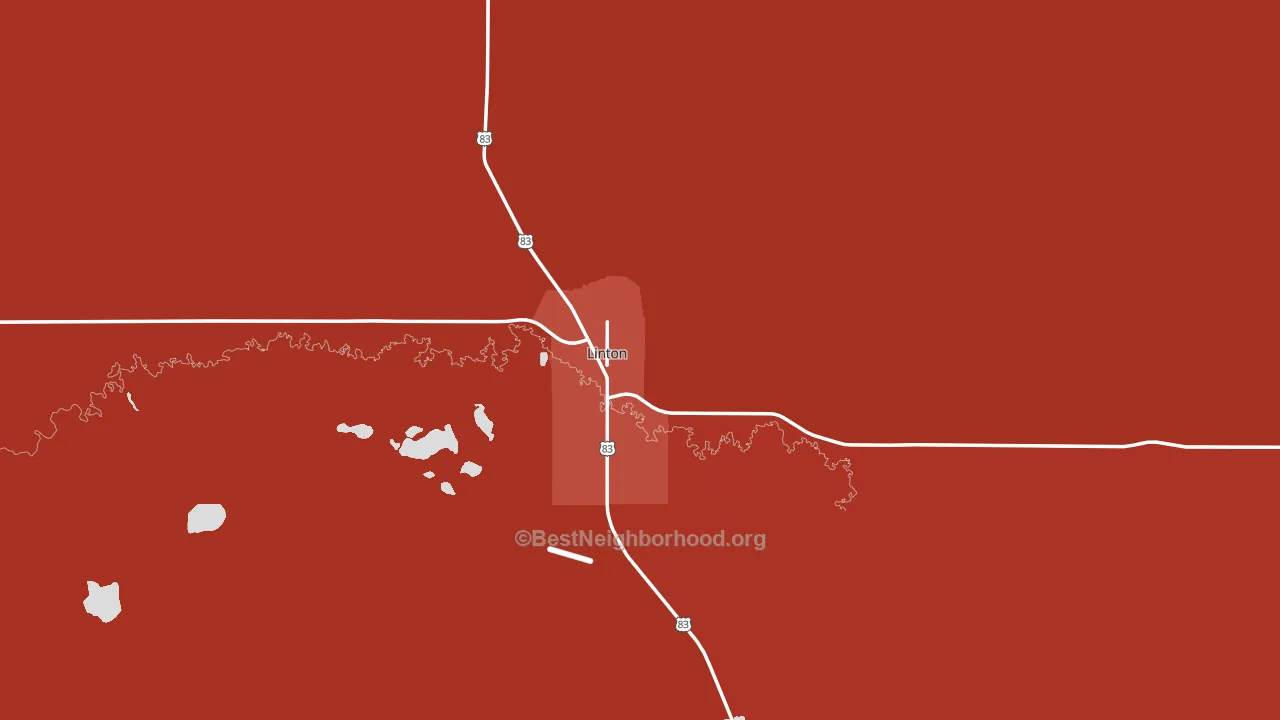
About 79% of adults in Emmons County typically vote, above the U.S. average of about 62%. Among adults in Emmons County, ~12% vote Democratic, ~67% Republican, and ~21% don't vote. The map below shows estimated turnout by block group.
How Emmons County compares
Among counties within 50 miles, Emmons County leans more Republican than 6 of 7 neighbors.
Emmons County runs about 34 points more Republican than North Dakota as a whole.
Why Emmons County leans the way it does
This analysis examined 14,881 data points per county to find what predicts political lean and turnout. The items below are a few correlations that stood out for Emmons County, not a ranked or complete list of what matters most.
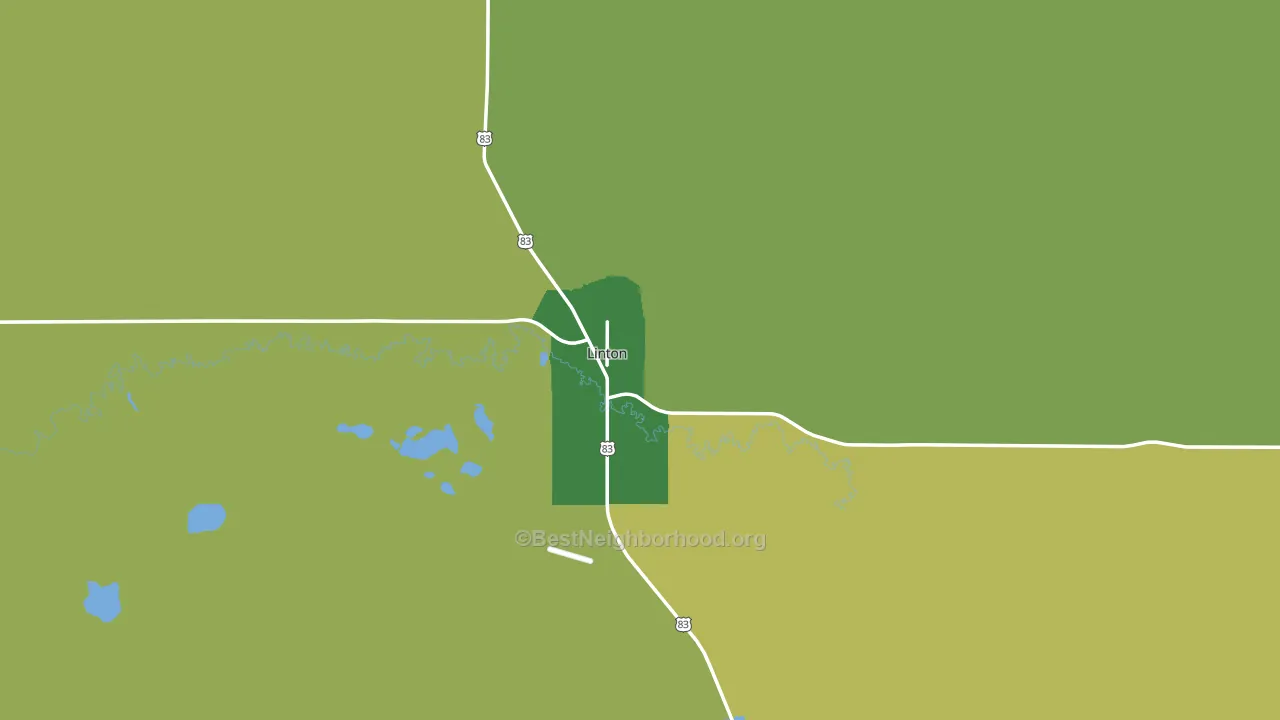
Rural areas vote Republican. About 9% of residents in Emmons County live in densely developed areas, about 27 points below the U.S. average of 36%.
Population density and Republican lean
Places with low population density tend to lean Republican; Emmons County, ND sits in the bottom quarter nationally on this measure.
Why turnout in Emmons County looks the way it does
Areas with strong routine healthcare access turn out at higher rates. Emmons County is in the top quarter nationally for routine-care measures such as insurance coverage, preventive screenings, and dental visits. The dental-visit rate here is about 65%, about 5 points above the U.S. average of 60%. Learn more about the findings and methodology on the political spectrum map.
Nearby Counties
- Sioux County, ND D+54
- Campbell County, SD R+66
- Logan County, ND R+75
- McIntosh County, ND R+61
- Burleigh County, ND R+32
- Corson County, SD D+38
- Kidder County, ND R+61
- Walworth County, SD R+56
- Morton County, ND R+49
- McPherson County, SD R+66
Counties with Similar Populations
- Concho County, TX R+71
- Upton County, TX R+58
- Granite County, MT R+38
- Coke County, TX R+72
- Harper County, OK R+80
- Donley County, TX R+66
- Knox County, TX R+66
- Tyrrell County, NC R+12
- Traverse County, MN R+42
- Sierra County, CA R+19
Sources and methodology
Precinct-level voting records used to fit the model come from North Dakota Secretary of State, Elections, distributed by the Voting and Election Science Team. Demographic inputs come from the U.S. Census Bureau (ACS 5-year estimates and the 2020 Decennial Census). Health and environmental inputs come from the CDC (PLACES and the Environmental Justice Index). Land cover comes from the USGS and EPA. Election-day and lead-up weather come from PRISM 4km daily grids and the NOAA Global Historical Climatology Network. Mail-voting and election-administration patterns come from the MIT Election Lab's Survey of the Performance of American Elections. Block-group crime detail comes from CrimeGrade. Internet data and modeling support provided by ISPreports.org.
Modeling and analysis by the BestNeighborhood data science team. Full methodology and findings: political spectrum map.
Methodology reviewed by the BestNeighborhood data team. Last updated May 2026.