Five Lakes leans heavily Republican by roughly 44 points: about 28% of voters vote Democratic and 72% Republican.
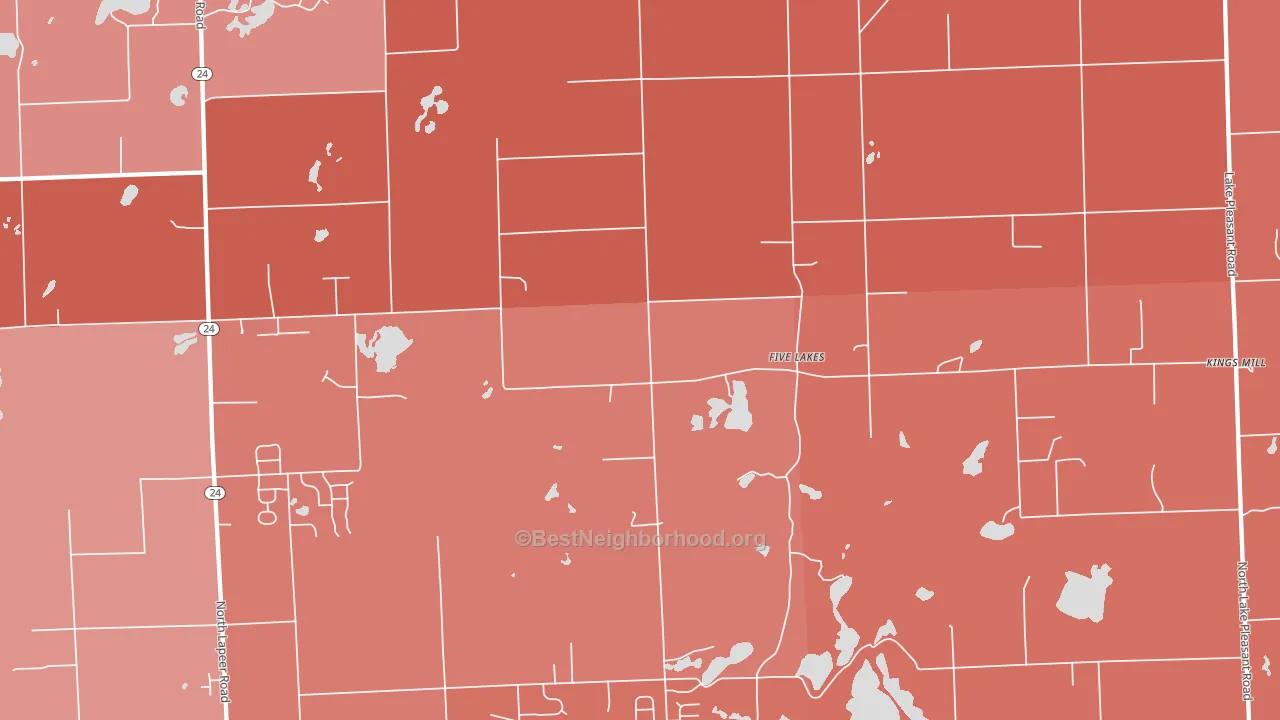
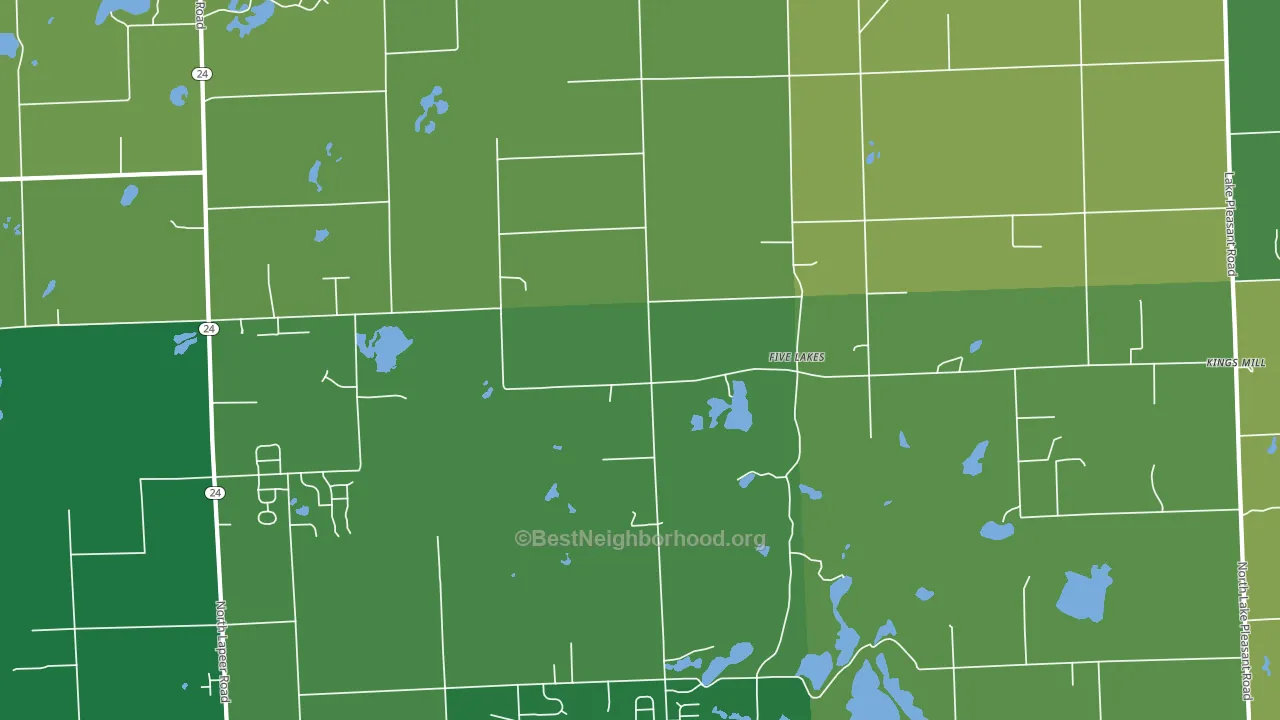
About 85% of adults in Five Lakes typically vote, above the U.S. average of about 62%. Among adults in Five Lakes, ~24% vote Democratic, ~61% Republican, and ~15% don't vote. The map below shows estimated turnout by block group.
How Five Lakes compares
Among cities within 25 miles, Five Lakes leans more Republican than 38 of 60 neighbors.
Five Lakes runs about 43 points more Republican than Michigan as a whole.
Why Five Lakes leans the way it does
This analysis examined 14,881 data points per city to find what predicts political lean and turnout. The items below are a few correlations that stood out for Five Lakes, not a ranked or complete list of what matters most.
Areas with a high white share and below-average college attainment vote Republican. In Five Lakes, about 95% of residents are non-Hispanic white, about 23 points above the U.S. average of 72%; about 17% of adults hold a bachelor's degree, about 9 points below the Michigan average of 26%. A high family-household share predicts Republican voting, and about 84% of households in Five Lakes are family households, above 95% of cities.
Walkability and Republican lean
Places with a low walkability score tend to lean Republican; Five Lakes, MI sits below the national average on this measure. A walkable street grid does not change how people vote; it mostly reflects how urban a place is.
Why turnout in Five Lakes looks the way it does
Homeowners vote more often than renters. About 96% of households in Five Lakes own their home, about 14 points above the Michigan average of 83%. Learn more about the findings and methodology on the political spectrum map.
Nearby Cities
- Barnes Lake-Millers Lake, MI R+40
- North Branch, MI R+46
- Lum, MI R+45
- Hunters Creek, MI R+36
- Columbiaville, MI R+39
- Lapeer, MI R+30
- Attica, MI R+44
- Fostoria, MI R+48
- Otter Lake, MI R+40
- Burnside, MI R+52
Cities with Similar Populations
- Verplanck, NY D+14
- Sharpsburg, KY R+55
- Jewett, OH R+62
- Hauser, ID R+61
- Indian Lake Estates, FL R+47
- Dover, MI R+53
- Gibson, NC R+12
- Sarona, WI R+26
- Clarksville, PA R+41
- Eddy, TX R+64
Sources and methodology
Precinct-level voting records used to fit the model come from Michigan Department of State, Elections, distributed by the Voting and Election Science Team. Demographic inputs come from the U.S. Census Bureau (ACS 5-year estimates and the 2020 Decennial Census). Health and environmental inputs come from the CDC (PLACES and the Environmental Justice Index). Land cover comes from the USGS and EPA. Election-day and lead-up weather come from PRISM 4km daily grids and the NOAA Global Historical Climatology Network. Mail-voting and election-administration patterns come from the MIT Election Lab's Survey of the Performance of American Elections. Block-group crime detail comes from CrimeGrade. Internet data and modeling support provided by ISPreports.org.
Modeling and analysis by the BestNeighborhood data science team. Full methodology and findings: political spectrum map.
Methodology reviewed by the BestNeighborhood data team. Last updated May 2026.