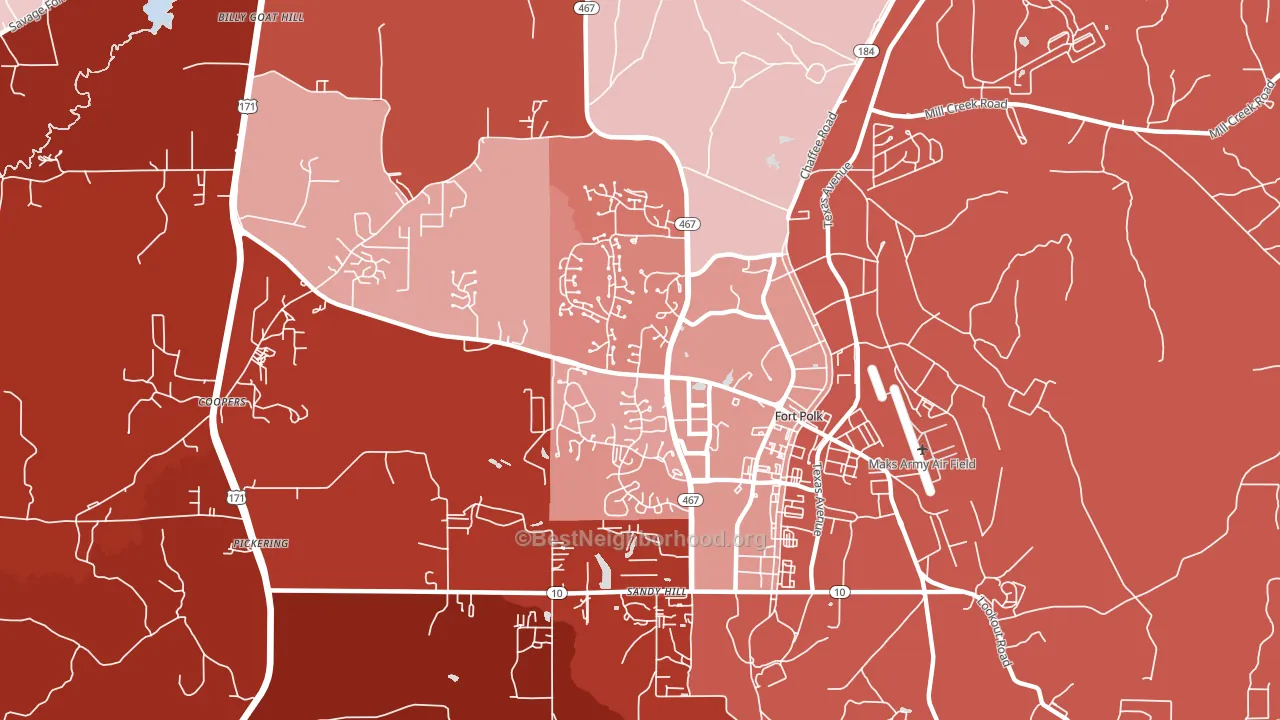
Fort Polk South leans Republican by roughly 22 points: about 39% of voters vote Democratic and 61% Republican.
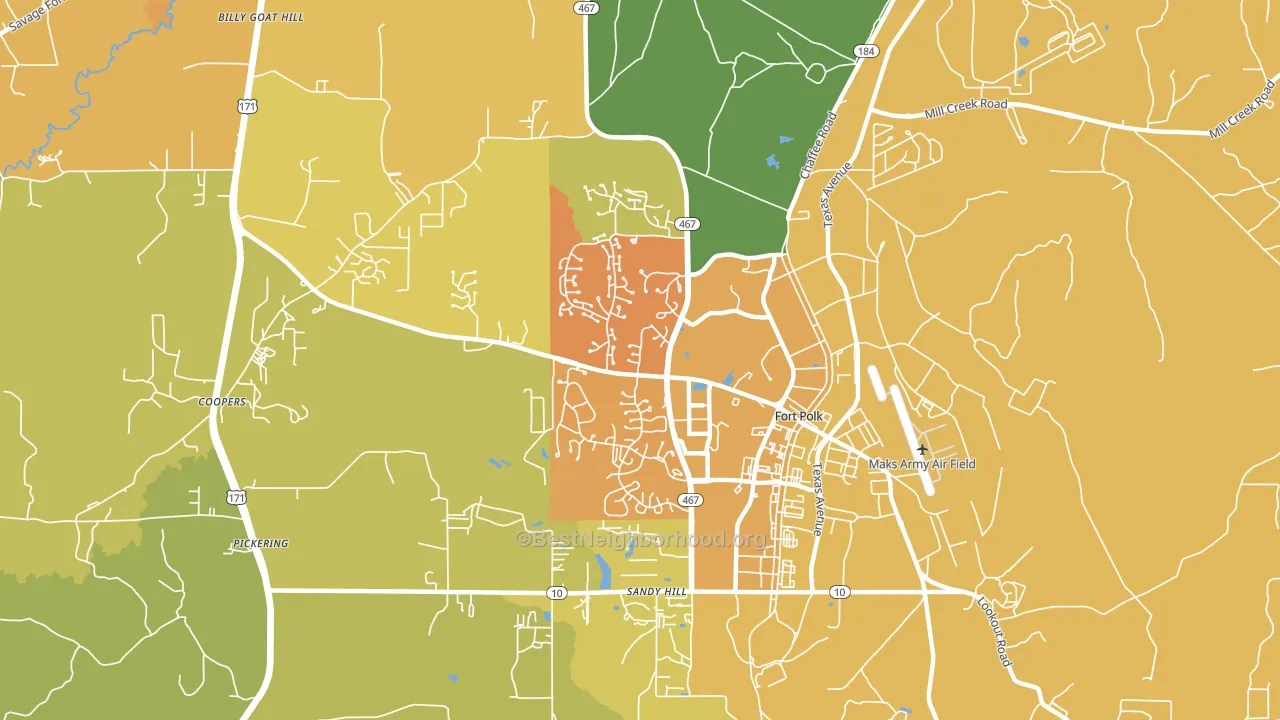
About 37% of adults in Fort Polk South typically vote, below the U.S. average of about 62%. Among adults in Fort Polk South, ~14% vote Democratic, ~23% Republican, and ~63% don't vote. The map below shows estimated turnout by block group.
How Fort Polk South compares
Among cities within 25 miles, Fort Polk South leans more Republican than 1 of 31 neighbors.
Politically, Fort Polk South sits close to the rest of Louisiana.
Politics vary noticeably by neighborhood within Fort Polk South. The northeast side is the most Republican-leaning (R+36) and the northwest side is the least Republican-leaning (R+15), a spread of about 21 points.
Why Fort Polk South leans the way it does
This analysis examined 14,881 data points per city to find what predicts political lean and turnout. The items below are a few correlations that stood out for Fort Polk South, not a ranked or complete list of what matters most.
Fort Polk South votes Republican even though it is densely developed (about 72%, far above the Louisiana average of 25%). State and regional patterns outweigh the Democratic lean that density usually predicts here. A high family-household share predicts Republican voting, and about 81% of households in Fort Polk South are family households, above 91% of cities.
Preventive-care access and voter turnout
Places with limited routine preventive-care access tend to turn out at a lower rate; Fort Polk South, LA sits below the national average on this measure. Dental visits do not drive turnout; the rate reflects income, insurance, and healthcare access, which line up with who votes.
Why turnout in Fort Polk South looks the way it does
Renters vote less often than owners. About 98% of households in Fort Polk South rent, about 73 points above the U.S. average of 25%. High food insecurity lines up with lower turnout, and about 20% of adults in Fort Polk South report food insecurity, above 81% of cities. Low high-school completion lines up with lower turnout, and about 97% of adults in Fort Polk South have completed high school, above 89% of cities. Learn more about the findings and methodology on the political spectrum map.
Nearby Cities
- Sandy Hill, LA R+75
- Fort Polk North, LA R+37
- Fullerton, LA R+42
- Leesville, LA R+48
- New Llano, LA R+14
- Elmwood, LA R+79
- Kurthwood, LA R+77
- Rosepine, LA R+75
- Hawthorne, LA R+76
- Walnut Hill, LA R+85
Cities with Similar Populations
- Valley Falls, SC R+12
- Manhasset, NY Even
- Mathis, TX R+21
- Berkeley, MO D+72
- Monroeville, AL R+3
- Lake Hallie, WI R+16
- Columbia Station, OH R+31
- Warrenville, SC R+47
- North Scituate, RI R+15
- Elma, WA R+24
Sources and methodology
Precinct-level voting records used to fit the model come from Louisiana Secretary of State, Elections, distributed by the Voting and Election Science Team. Demographic inputs come from the U.S. Census Bureau (ACS 5-year estimates and the 2020 Decennial Census). Health and environmental inputs come from the CDC (PLACES and the Environmental Justice Index). Land cover comes from the USGS and EPA. Election-day and lead-up weather come from PRISM 4km daily grids and the NOAA Global Historical Climatology Network. Mail-voting and election-administration patterns come from the MIT Election Lab's Survey of the Performance of American Elections. Block-group crime detail comes from CrimeGrade. Internet data and modeling support provided by ISPreports.org.
Modeling and analysis by the BestNeighborhood data science team. Full methodology and findings: political spectrum map.
Methodology reviewed by the BestNeighborhood data team. Last updated May 2026.