Glenbrook leans Republican by roughly 28 points: about 36% of voters vote Democratic and 64% Republican.
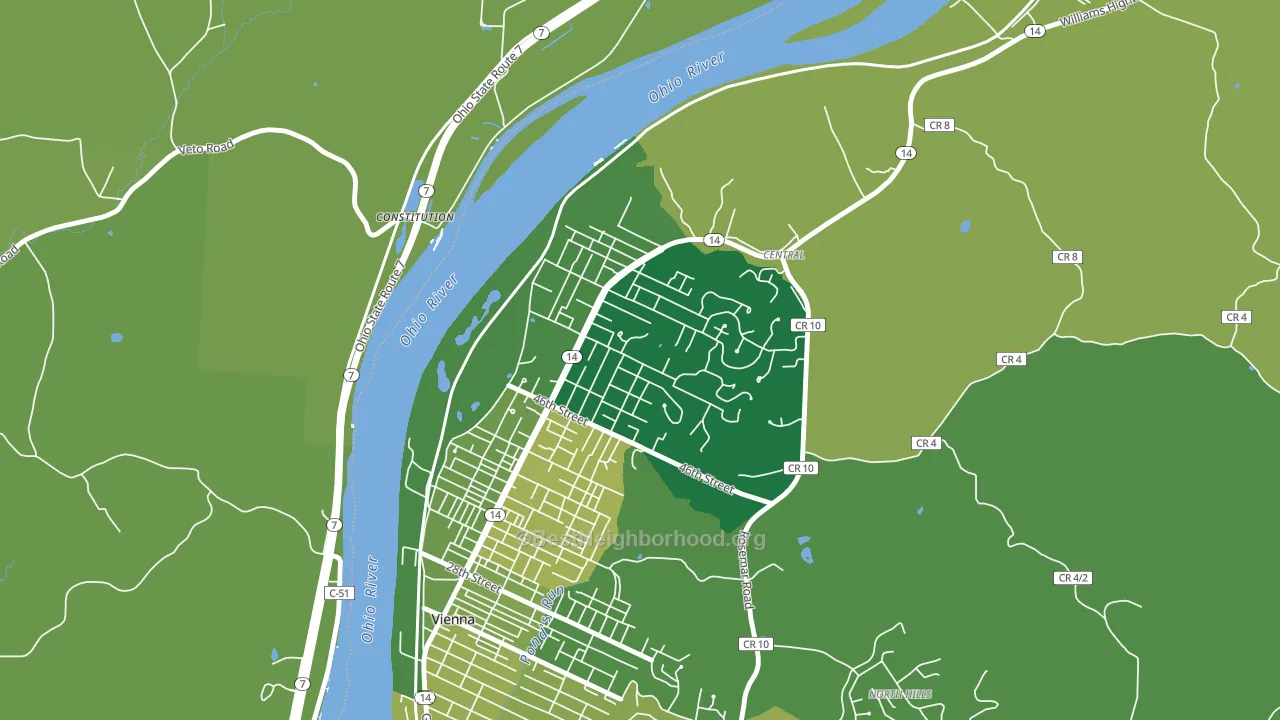
About 98% of adults in Glenbrook typically vote, above the U.S. average of about 62%. Among adults in Glenbrook, ~35% vote Democratic, ~63% Republican, and ~2% don't vote. The map below shows estimated turnout by block group.
How Glenbrook compares
Glenbrook runs about 13 points more Democratic than West Virginia as a whole.
Why Glenbrook leans the way it does
Density, race composition, education, and family structure all sit close to their national averages in Glenbrook. The lean here lands roughly where demographic data alone would predict.
Paved land cover and Republican lean
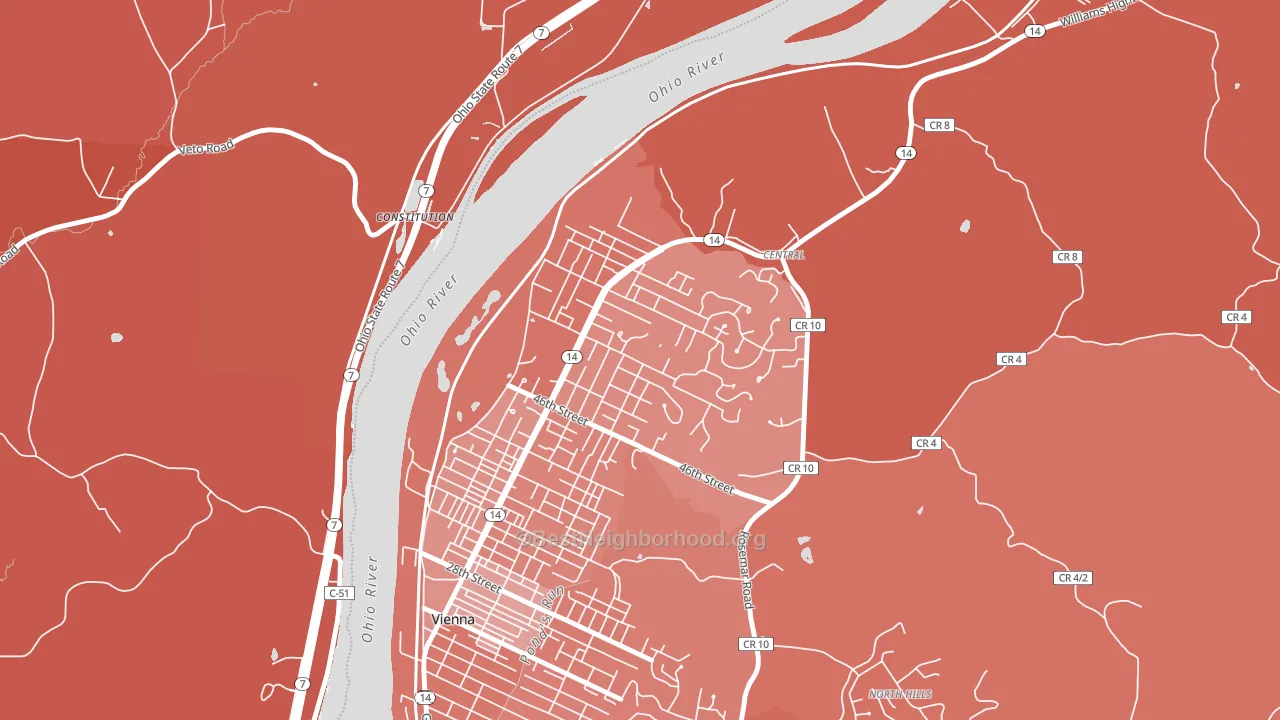
Places with little paved surface tend to lean Republican; Glenbrook, Vienna, WV sits in the bottom quarter nationally on this measure. Paved ground does not change how people vote; it mostly reflects how urban and built-up a place is.
Why turnout in Glenbrook looks the way it does
Areas with strong routine healthcare access turn out at higher rates. Glenbrook is in the top quarter nationally for routine-care measures such as insurance coverage, preventive screenings, and dental visits. The dental-visit rate here is about 65%, about 5 points above the U.S. average of 60%. Homeowners vote more often than renters, and about 89% of households in Glenbrook own their home, compared to around 51% in nearby neighborhoods. Learn more about the findings and methodology on the political spectrum map.
Nearby Neighborhoods
- Beechwood, Parkersburg, WV R+25
- Marietta Historic District, Marietta, OH Even
- Wheeling Avenue Historic District, Cambridge, OH R+29
- Brighton Historic District, Zanesville, OH R+17
- Barnesville Historic District, Barnesville, OH R+52
- McIntire Terrace Historic District, Zanesville, OH R+12
- Lancaster Historic District, Lancaster, OH R+15
- West Side, Charleston, WV D+43
- Hudson Avenue Historic District, Newark, OH R+24
- East End, Charleston, WV D+44
Neighborhoods with Similar Populations
- Almeta-Bonita-Bella Vista, Garland, TX D+15
- Webster Park-Shady Dell, Springfield, MO R+27
- Northhampton, Converse, TX D+24
- Lincoln Park-Syracuse, Syracuse, NY D+42
- Isetts, Kenosha, WI D+9
- College Grandview District, Dubuque, IA D+12
- North Village, Cuyahoga Falls, OH D+7
- Sayler Park, Cincinnati, OH R+18
- Winter Halter, Detroit, MI D+87
- South Shore Harbour and Marina, League City, TX R+20
Sources and methodology
Precinct-level voting records used to fit the model come from West Virginia Secretary of State, Elections, distributed by the Voting and Election Science Team. Demographic inputs come from the U.S. Census Bureau (ACS 5-year estimates and the 2020 Decennial Census). Health and environmental inputs come from the CDC (PLACES and the Environmental Justice Index). Land cover comes from the USGS and EPA. Election-day and lead-up weather come from PRISM 4km daily grids and the NOAA Global Historical Climatology Network. Mail-voting and election-administration patterns come from the MIT Election Lab's Survey of the Performance of American Elections. Block-group crime detail comes from CrimeGrade. Internet data and modeling support provided by ISPreports.org.
Modeling and analysis by the BestNeighborhood data science team. Full methodology and findings: political spectrum map.
Methodology reviewed by the BestNeighborhood data team. Last updated May 2026.