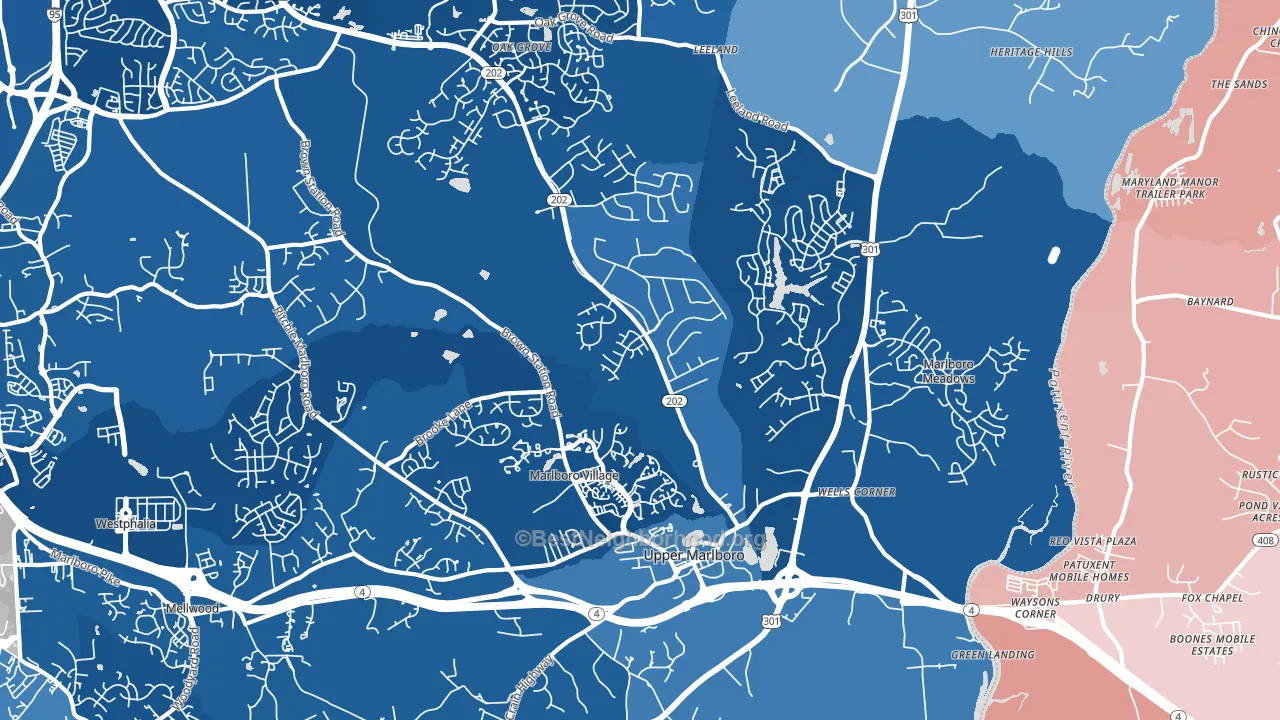
Greater Upper Marlboro is a Democratic stronghold. About 90% of voters here vote Democratic and 10% Republican.
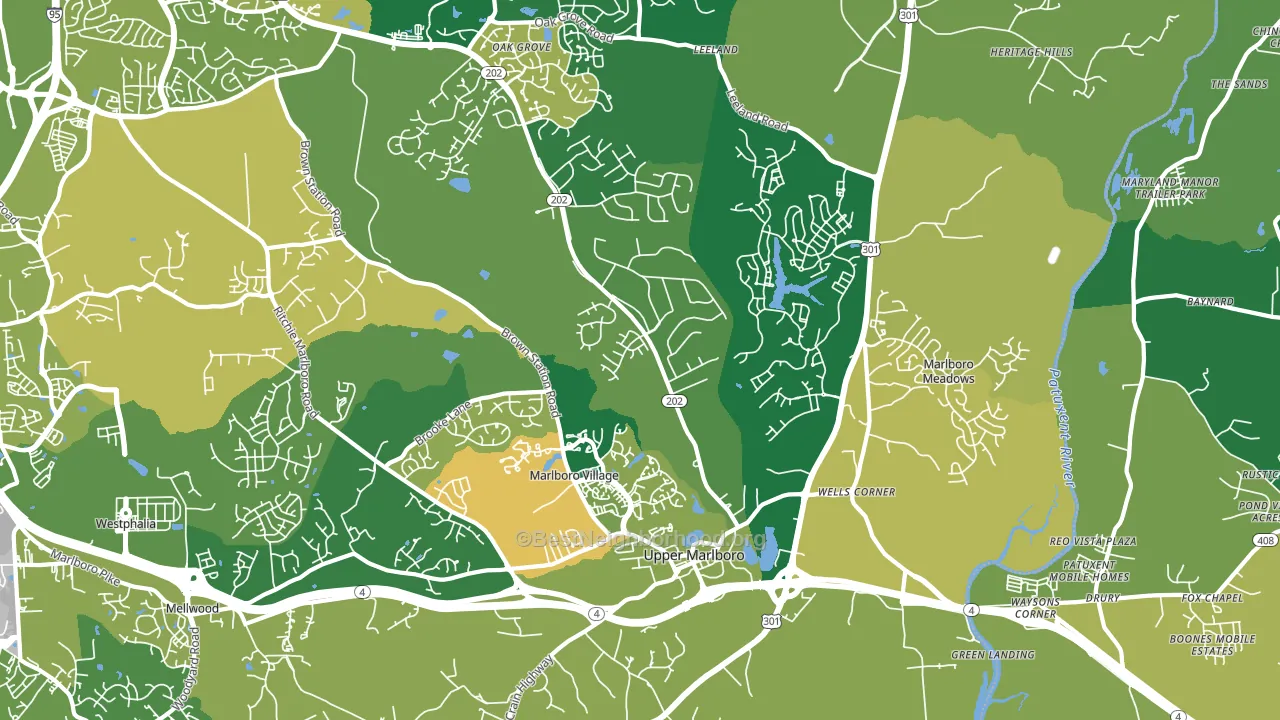
About 81% of adults in Greater Upper Marlboro typically vote, above the U.S. average of about 62%. Among adults in Greater Upper Marlboro, ~73% vote Democratic, ~8% Republican, and ~19% don't vote. The map below shows estimated turnout by block group.
How Greater Upper Marlboro compares
Greater Upper Marlboro runs about 52 points more Democratic than Maryland as a whole.
Politics vary noticeably by block within Greater Upper Marlboro. The west side is the most Democratic-leaning (D+84) and the south side is the least Democratic-leaning (D+57), a spread of about 27 points.
Why Greater Upper Marlboro leans the way it does
This analysis examined 14,881 data points per neighborhood to find what predicts political lean and turnout. The items below are a few correlations that stood out for Greater Upper Marlboro, not a ranked or complete list of what matters most.
Rural, majority-Black areas of the Southern Black Belt vote Democratic, against the usual rural pattern. About 82% of residents in Greater Upper Marlboro are Black or African American, about 63 points above the Maryland average of 20%.
Preventive-care access and voter turnout
Places with strong routine preventive-care access tend to turn out at a higher rate; Greater Upper Marlboro, Brock Hall, MD sits above the national average on this measure. Dental visits do not drive turnout; the rate reflects income, insurance, and healthcare access, which line up with who votes.
Why turnout in Greater Upper Marlboro looks the way it does
Areas with strong routine healthcare access turn out at higher rates. Greater Upper Marlboro is in the top quarter nationally for routine-care measures such as insurance coverage, preventive screenings, and dental visits. The dental-visit rate here is about 66%, about 6 points above the U.S. average of 60%. Homeowners vote more often than renters, and about 88% of households in Greater Upper Marlboro own their home, compared to around 54% in nearby neighborhoods. Learn more about the findings and methodology on the political spectrum map.
Nearby Neighborhoods
- Walker Mill, District Heights, MD D+86
- Suitland-Silver Hill, Suitland, MD D+86
- Greater Landover, Landover, MD D+78
- Hillside, Coral Hills, MD D+85
- Lanham-Seabrook, Lanham, MD D+67
- Deanwood, Washington, DC D+86
- Woodlawn Hayattsville, Hyattsville, MD D+65
- Goddard, Seabrook, MD D+71
- Anacostia, Washington, DC D+85
- Fairlawn, Washington, DC D+86
Neighborhoods with Similar Populations
- Portar Ranch, Northridge, CA D+12
- Petworth, Washington, DC D+86
- Weequahic, Newark, NJ D+81
- West Village, Manhattan, NY D+68
- Oxon Hill-Glassmanor, Oxon Hill, MD D+79
- Pocket, Sacramento, CA D+40
- Flint Village, Fall River, MA Even
- Poplar-Ludlow-Yorktowne, Philadelphia, PA D+77
- South Norfolk, Chesapeake, VA D+38
- Rice Military, Houston, TX D+22
Sources and methodology
Precinct-level voting records used to fit the model come from Maryland State Board of Elections, distributed by the Voting and Election Science Team. Demographic inputs come from the U.S. Census Bureau (ACS 5-year estimates and the 2020 Decennial Census). Health and environmental inputs come from the CDC (PLACES and the Environmental Justice Index). Land cover comes from the USGS and EPA. Election-day and lead-up weather come from PRISM 4km daily grids and the NOAA Global Historical Climatology Network. Mail-voting and election-administration patterns come from the MIT Election Lab's Survey of the Performance of American Elections. Block-group crime detail comes from CrimeGrade. Internet data and modeling support provided by ISPreports.org.
Modeling and analysis by the BestNeighborhood data science team. Full methodology and findings: political spectrum map.
Methodology reviewed by the BestNeighborhood data team. Last updated May 2026.