Hillside is a Democratic stronghold. About 93% of voters here vote Democratic and 7% Republican.
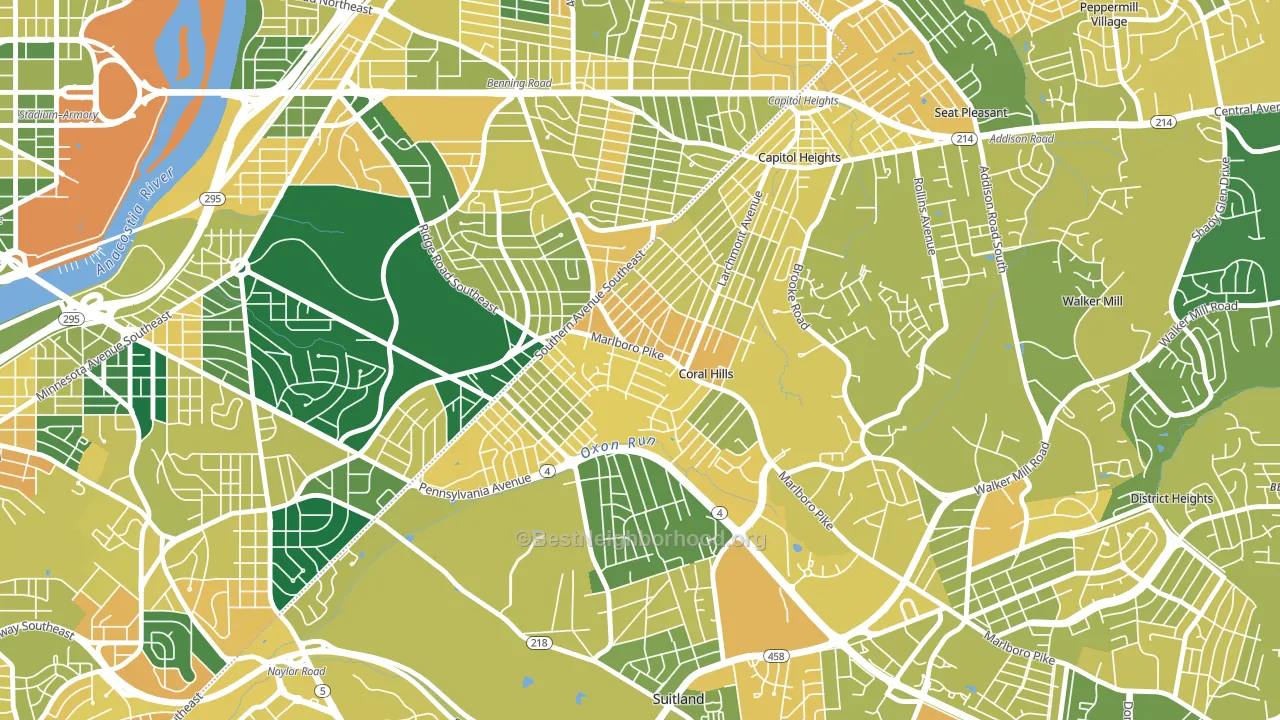
About 55% of adults in Hillside typically vote, below the U.S. average of about 62%. Among adults in Hillside, ~51% vote Democratic, ~4% Republican, and ~45% don't vote. The map below shows estimated turnout by block group.
How Hillside compares
Among neighborhoods within 5 miles, Hillside leans more Democratic than 9 of 15 neighbors.
Hillside runs about 57 points more Democratic than Maryland as a whole.
Why Hillside leans the way it does
This analysis examined 14,881 data points per neighborhood to find what predicts political lean and turnout. The items below are a few correlations that stood out for Hillside, not a ranked or complete list of what matters most.
Areas with many never-married adults vote Democratic. About 49% of adults in Hillside have never been married, modestly above similar-sized neighborhoods (around 35%).
Park access and Democratic lean
Places with heavy park coverage tend to lean Democratic; Hillside, Coral Hills, MD sits in the top quarter nationally on this measure. Park access does not change how people vote; it tends to track denser, higher-income areas.
Why turnout in Hillside looks the way it does
High-crime urban areas turn out at lower rates, mostly because the housing stress common in those areas makes voting harder. Hillside sits in the top 15% nationally on a violent-crime measure. See CrimeGrade for more details. Learn more about the findings and methodology on the political spectrum map.
Nearby Neighborhoods
- Suitland-Silver Hill, Suitland, MD D+86
- Walker Mill, District Heights, MD D+86
- Deanwood, Washington, DC D+86
- Anacostia, Washington, DC D+85
- Fairlawn, Washington, DC D+86
- Hill East, Washington, DC D+80
- Stadium-Armory, Washington, DC D+85
- Lincoln Park, Washington, DC D+84
- Stanton Park, Washington, DC D+84
- Capitol Hill, Washington, DC D+77
Neighborhoods with Similar Populations
- Heather Ridge, Aurora, CO D+35
- Second Creek, Mobile, AL R+21
- Canyon Park, Bothell, WA D+22
- Stony Creek, Ken Caryl, CO D+7
- Quail Hollow, Charlotte, NC D+15
- Midvale Heights, Madison, WI D+76
- Hopkins Fitch Grant, Holly Hill, FL R+4
- North Willow Farms, Indianapolis, IN D+49
- Brice Street Area, Greensboro, NC D+61
- Cedar Ridge, Waco, TX R+7
Sources and methodology
Precinct-level voting records used to fit the model come from Maryland State Board of Elections, distributed by the Voting and Election Science Team. Demographic inputs come from the U.S. Census Bureau (ACS 5-year estimates and the 2020 Decennial Census). Health and environmental inputs come from the CDC (PLACES and the Environmental Justice Index). Land cover comes from the USGS and EPA. Election-day and lead-up weather come from PRISM 4km daily grids and the NOAA Global Historical Climatology Network. Mail-voting and election-administration patterns come from the MIT Election Lab's Survey of the Performance of American Elections. Block-group crime detail comes from CrimeGrade. Internet data and modeling support provided by ISPreports.org.
Modeling and analysis by the BestNeighborhood data science team. Full methodology and findings: political spectrum map.
Methodology reviewed by the BestNeighborhood data team. Last updated May 2026.