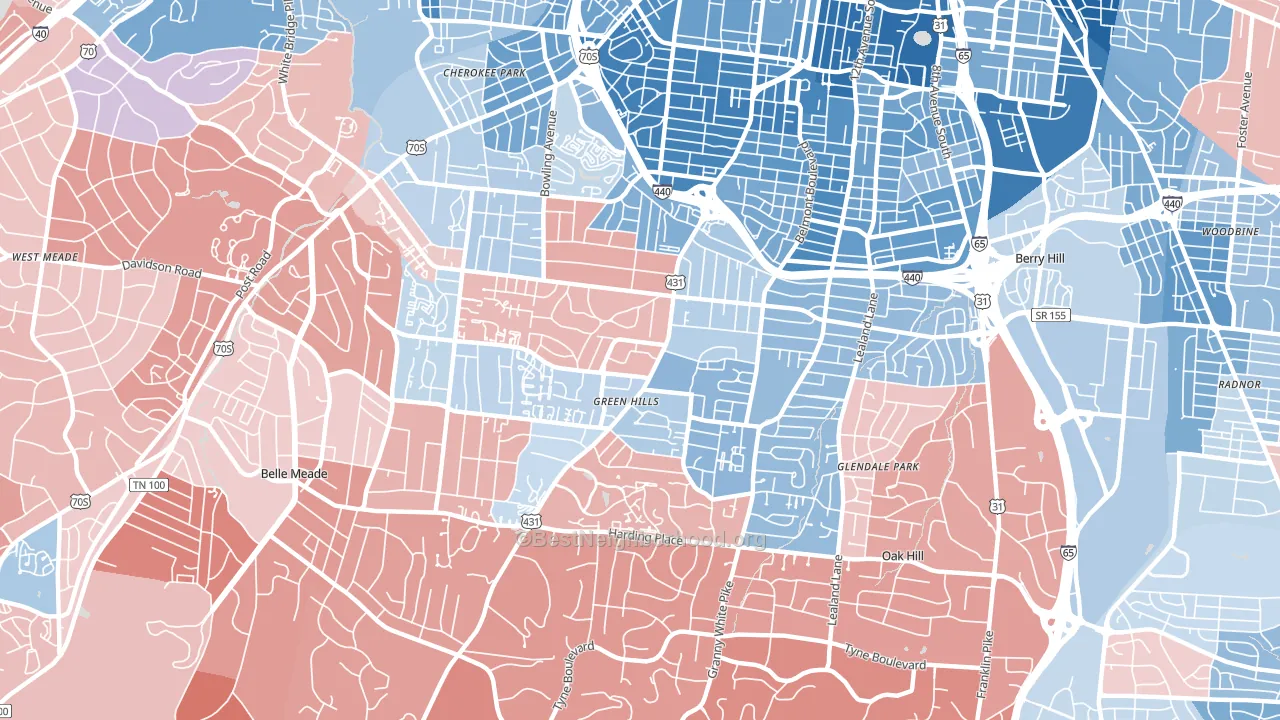
Green Hills leans slightly Democratic by roughly 14 points: about 57% of voters vote Democratic and 43% Republican.
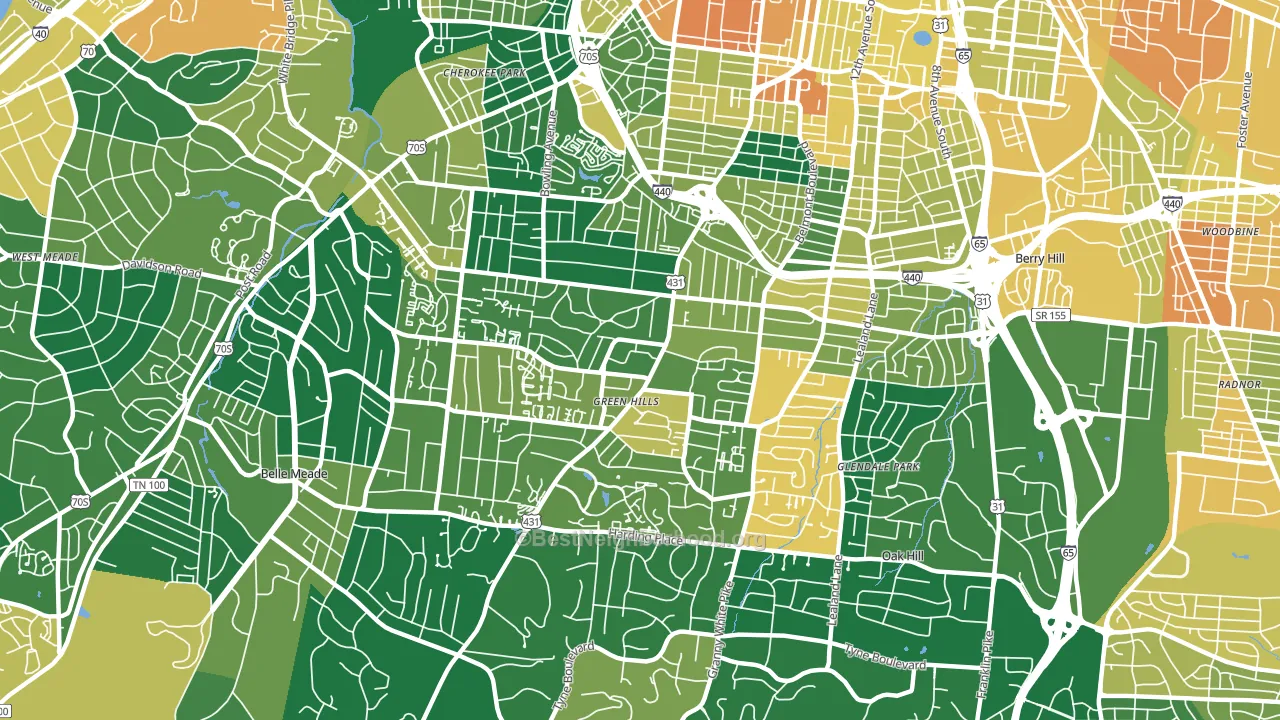
About 80% of adults in Green Hills typically vote, above the U.S. average of about 62%. Among adults in Green Hills, ~46% vote Democratic, ~34% Republican, and ~20% don't vote. The map below shows estimated turnout by block group.
How Green Hills compares
Among neighborhoods within 5 miles, Green Hills leans more Democratic than 5 of 18 neighbors.
Green Hills runs about 43 points more Democratic than Tennessee as a whole. Tennessee leans Republican overall, while Green Hills is one of the few Democratic-leaning pockets.
Politics vary noticeably by block within Green Hills. The northeast side runs the most Democratic (D+37) and the southwest side runs the most Republican (R+9), a spread of about 45 points.
Why Green Hills leans the way it does
This analysis examined 14,881 data points per neighborhood to find what predicts political lean and turnout. The items below are a few correlations that stood out for Green Hills, not a ranked or complete list of what matters most.
Areas with high college attainment vote Democratic. About 81% of adults in Green Hills hold a bachelor's degree, about 52 points above the U.S. average of 28%. Green Hills runs against the grain of Tennessee, a Democratic-leaning pocket in a Republican-leaning state.
Cancer-screening access and voter turnout
Places with high colon-cancer-screening access tend to turn out at a higher rate; Green Hills, Nashville, TN sits in the top quarter nationally on this measure. Cancer screening does not drive turnout; it reflects income, insurance, and healthcare access.
Why turnout in Green Hills looks the way it does
Areas with strong routine healthcare access turn out at higher rates. Green Hills is in the top quarter nationally for routine-care measures such as insurance coverage, preventive screenings, and dental visits. The dental-visit rate here is about 74%, about 14 points above the U.S. average of 60%. High high-school completion lines up with higher turnout, and about 98% of adults in Green Hills have completed high school, above 87% of neighborhoods. Learn more about the findings and methodology on the political spectrum map.
Nearby Neighborhoods
- Hillsboro West End, Nashville, TN D+45
- Bellmont Hillsboro, Nashville, TN D+51
- Melrose, Nashville, TN D+41
- Cherokee Park, Nashville, TN D+44
- Vanderbilt-West End, Nashville, TN D+54
- Edgehill, Nashville, TN D+64
- Sylvan Park, Nashville, TN D+38
- Midtown-Nashville, Nashville, TN D+32
- The Gulch, Nashville, TN D+11
- White Bridge, Nashville, TN D+20
Neighborhoods with Similar Populations
- Eastchester, Bronx, NY D+63
- Boerum Hill, Brooklyn, NY D+77
- Fishtown, Philadelphia, PA D+66
- College Area, San Diego, CA D+41
- Hazelwood-Mill Park, Portland, OR D+33
- Back Bay, Boston, MA D+62
- Mxcully-Moiliili, Honolulu, HI D+34
- Logan-Ogontz-Fern Rock, Philadelphia, PA D+85
- Cooper Mountain-Aloha North, Aloha, OR D+29
- Clifton, Staten Island, NY D+33
Sources and methodology
Precinct-level voting records used to fit the model come from Tennessee Secretary of State, Division of Elections, distributed by the Voting and Election Science Team. Demographic inputs come from the U.S. Census Bureau (ACS 5-year estimates and the 2020 Decennial Census). Health and environmental inputs come from the CDC (PLACES and the Environmental Justice Index). Land cover comes from the USGS and EPA. Election-day and lead-up weather come from PRISM 4km daily grids and the NOAA Global Historical Climatology Network. Mail-voting and election-administration patterns come from the MIT Election Lab's Survey of the Performance of American Elections. Block-group crime detail comes from CrimeGrade. Internet data and modeling support provided by ISPreports.org.
Modeling and analysis by the BestNeighborhood data science team. Full methodology and findings: political spectrum map.
Methodology reviewed by the BestNeighborhood data team. Last updated May 2026.