Hacienda Heights leans Democratic by roughly 16 points: about 58% of voters vote Democratic and 42% Republican.
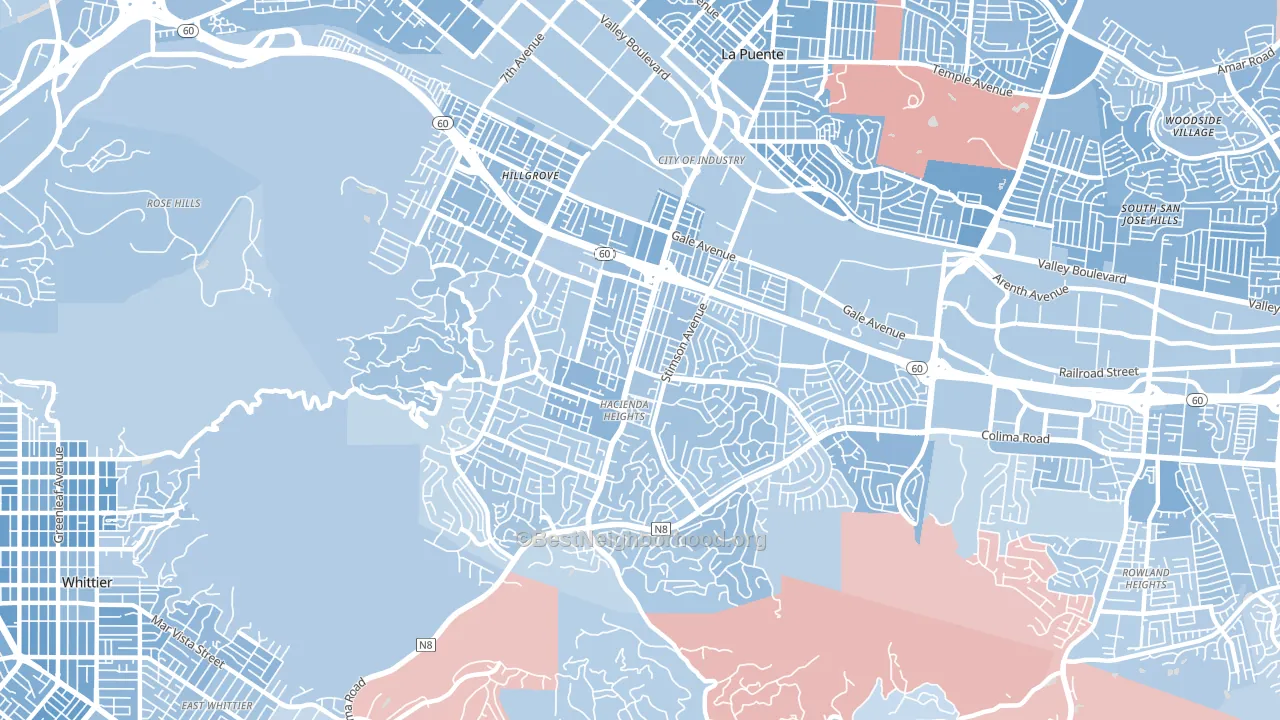
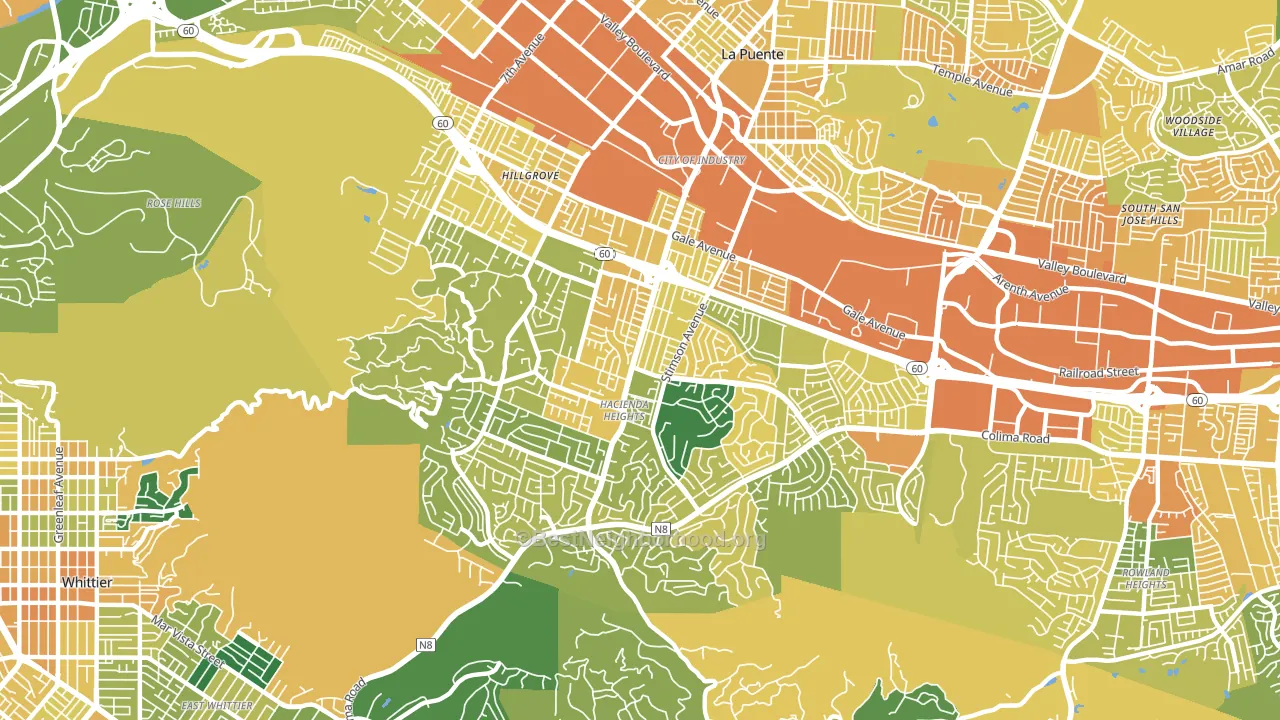
About 57% of adults in Hacienda Heights typically vote, near the U.S. average of about 62%. Among adults in Hacienda Heights, ~33% vote Democratic, ~24% Republican, and ~43% don't vote. The map below shows estimated turnout by block group.
How Hacienda Heights compares
Among cities within 25 miles, Hacienda Heights leans more Democratic than 51 of 134 neighbors.
Hacienda Heights runs about 5 points more Republican than California as a whole.
Why Hacienda Heights leans the way it does
This analysis examined 14,881 data points per city to find what predicts political lean and turnout. The items below are a few correlations that stood out for Hacienda Heights, not a ranked or complete list of what matters most.
Dense areas vote Democratic. About 93% of residents in Hacienda Heights live in densely developed areas, about 57 points above the U.S. average of 36%. High college attainment predicts Democratic voting, and Hacienda Heights sits in the top quarter (about 35%, above 82% of cities). A high never-married share predicts Democratic voting, and about 35% of adults in Hacienda Heights have never been married, above 87% of cities.
Paved land cover and Democratic lean
Places with extensive paved surfaces tend to lean Democratic; Hacienda Heights, CA sits in the top tenth nationally on this measure. Paved ground does not change how people vote; it mostly reflects how urban and built-up a place is.
Why turnout in Hacienda Heights looks the way it does
Crowded housing lines up with lower turnout. About 6% of homes in Hacienda Heights have more than one occupant per room, above 92% of cities. Learn more about the findings and methodology on the political spectrum map.
Nearby Cities
- La Puente, CA D+28
- Industry, CA D+15
- La Habra Heights, CA R+10
- Avocado Heights, CA D+25
- Valinda, CA D+24
- South San Jose Hills, CA D+28
- West Puente Valley, CA D+30
- Whittier, CA D+18
- Rowland Heights, CA D+10
- La Habra, CA D+5
Cities with Similar Populations
- Oak Park, IL D+78
- Fuquay-Varina, NC R+4
- Tinley Park, IL R+4
- Hollister, CA D+13
- Catalina Foothills, AZ D+20
- Peabody, MA D+4
- Diamond Bar, CA D+11
- Hialeah Gardens, FL R+43
- Redford, MI D+49
- Covington, LA R+39
Sources and methodology
Precinct-level voting records used to fit the model come from California Secretary of State, Elections, distributed by the Voting and Election Science Team. Demographic inputs come from the U.S. Census Bureau (ACS 5-year estimates and the 2020 Decennial Census). Health and environmental inputs come from the CDC (PLACES and the Environmental Justice Index). Land cover comes from the USGS and EPA. Election-day and lead-up weather come from PRISM 4km daily grids and the NOAA Global Historical Climatology Network. Mail-voting and election-administration patterns come from the MIT Election Lab's Survey of the Performance of American Elections. Block-group crime detail comes from CrimeGrade. Internet data and modeling support provided by ISPreports.org.
Modeling and analysis by the BestNeighborhood data science team. Full methodology and findings: political spectrum map.
Methodology reviewed by the BestNeighborhood data team. Last updated May 2026.