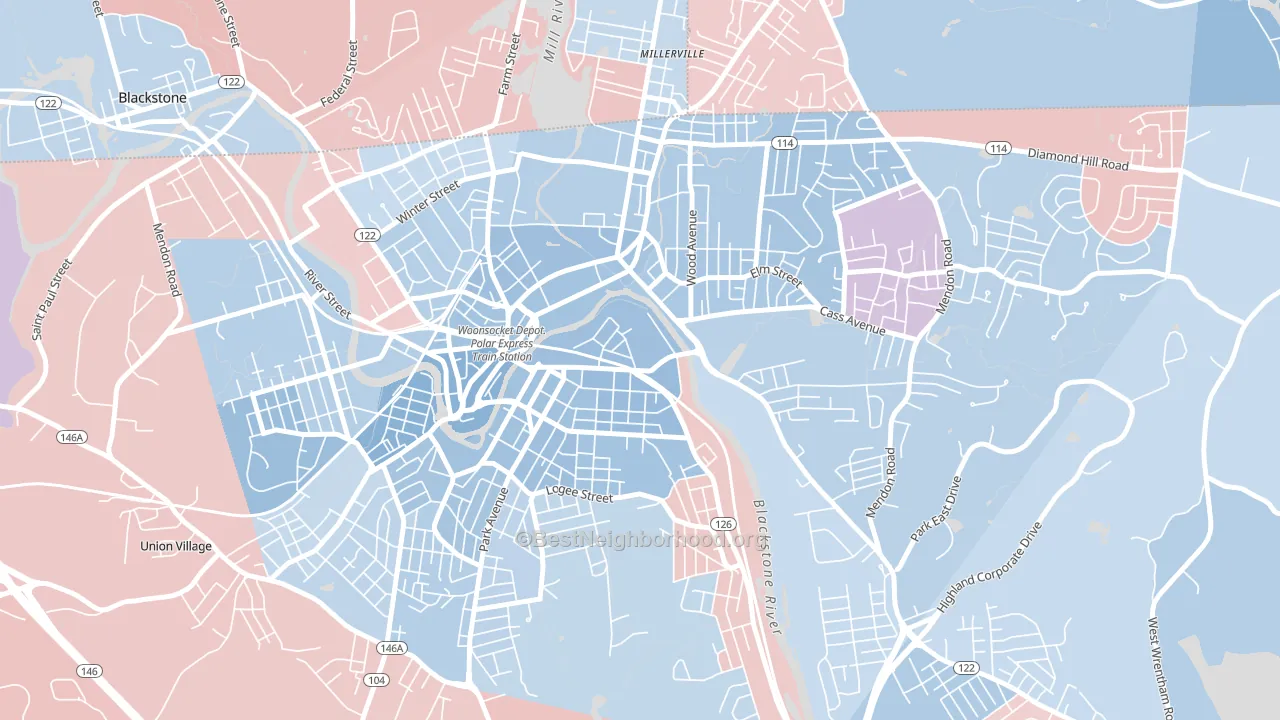
Hamlet leans Democratic by roughly 18 points: about 59% of voters vote Democratic and 41% Republican. These figures are model estimates: Rhode Island did not have precinct-level voting records available for training, so the numbers above come from demographic and health features rather than local ground truth.
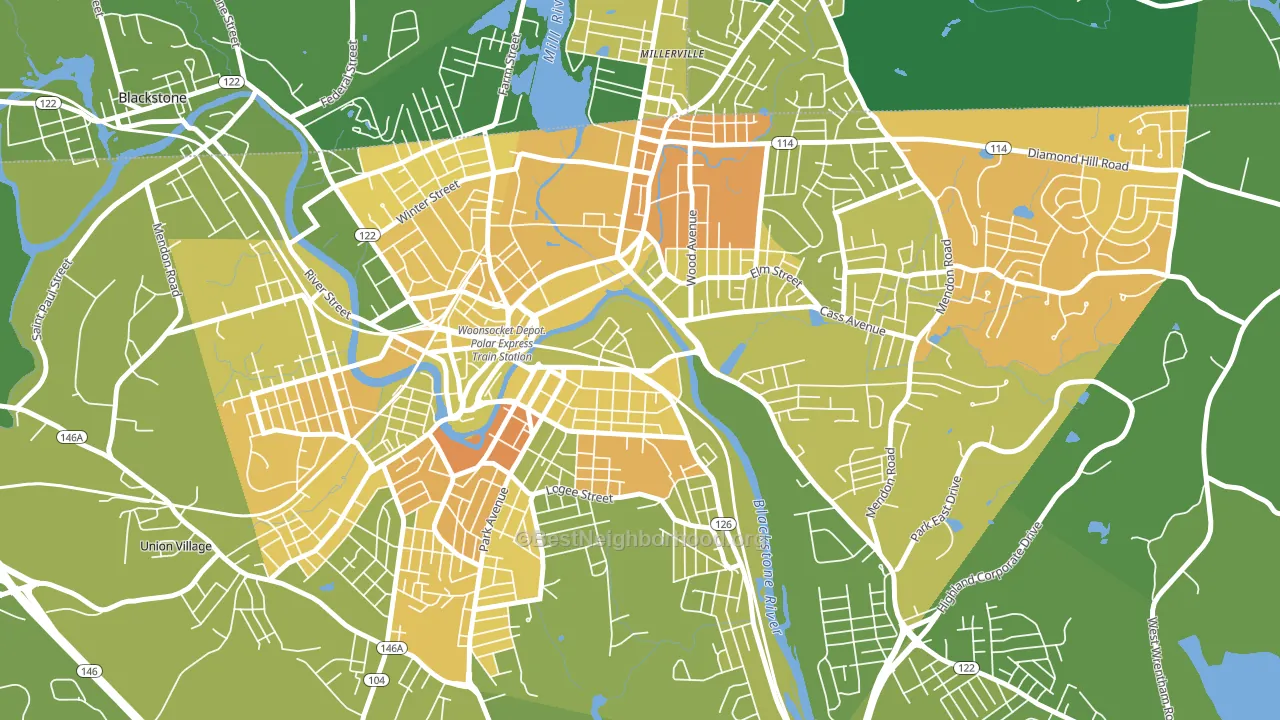
About 43% of adults in Hamlet typically vote, below the U.S. average of about 62%. Among adults in Hamlet, ~25% vote Democratic, ~18% Republican, and ~57% don't vote. The map below shows estimated turnout by block group.
How Hamlet compares
Among neighborhoods within 5 miles, Hamlet leans more Democratic than 2 of 3 neighbors.
Hamlet runs about 5 points more Democratic than Rhode Island as a whole.
Politics vary noticeably by block within Hamlet. The west side runs the most Democratic (D+25) and the southeast side runs the most Republican (R+7), a spread of about 32 points.
Why Hamlet leans the way it does
This analysis examined 14,881 data points per neighborhood to find what predicts political lean and turnout. The items below are a few correlations that stood out for Hamlet, not a ranked or complete list of what matters most.
Areas with many never-married adults vote Democratic. About 47% of adults in Hamlet have never been married, modestly above similar-sized neighborhoods (around 39%).
Park access and Democratic lean
Places with heavy park coverage tend to lean Democratic; Hamlet, Woonsocket, RI sits in the top quarter nationally on this measure. Park access does not change how people vote; it tends to track denser, higher-income areas.
Why turnout in Hamlet looks the way it does
Renters vote less often than owners. About 76% of households in Hamlet rent, about 51 points above the U.S. average of 25%. High food insecurity lines up with lower turnout, and about 30% of adults in Hamlet report food insecurity, above 82% of neighborhoods. Learn more about the findings and methodology on the political spectrum map.
Nearby Neighborhoods
- Social, Woonsocket, RI D+19
- Bernon Heights, Woonsocket, RI D+4
- Globe, Woonsocket, RI D+16
- Happy Hollow, Valley Falls, RI Even
- Twin Rivers Beach, Providence, RI D+12
- Marieville, Providence, RI D+12
- Fairlawn, Pawtucket, RI D+22
- Centerdale, Providence, RI D+10
- Darlington, Pawtucket, RI D+22
- Woodlawn, Pawtucket, RI D+40
Neighborhoods with Similar Populations
- Downtown Charlotte, Charlotte, NC D+32
- Willowcreek, Sacramento, CA D+44
- Washington Village, Boulder, CO D+77
- North Alameda, Lakewood, CO D+21
- Lakewood, Ann Arbor, MI D+45
- Hubbard-Richard, Detroit, MI D+46
- Regent Square, Pittsburgh, PA D+71
- View Ridge-Madison, Everett, WA D+12
- Timmerman West, Milwaukee, WI D+47
- Lynnhurst, Minneapolis, MN D+77
Sources and methodology
Precinct-level voting records used to fit the model come from Rhode Island Board of Elections, distributed by the Voting and Election Science Team. Demographic inputs come from the U.S. Census Bureau (ACS 5-year estimates and the 2020 Decennial Census). Health and environmental inputs come from the CDC (PLACES and the Environmental Justice Index). Land cover comes from the USGS and EPA. Election-day and lead-up weather come from PRISM 4km daily grids and the NOAA Global Historical Climatology Network. Mail-voting and election-administration patterns come from the MIT Election Lab's Survey of the Performance of American Elections. Block-group crime detail comes from CrimeGrade. Internet data and modeling support provided by ISPreports.org.
Modeling and analysis by the BestNeighborhood data science team. RI did not have precinct-level voting records available for training, so the figures here come from extrapolation across demographic, health, and land-use features rather than local ground truth. Full methodology and findings: political spectrum map.
Methodology reviewed by the BestNeighborhood data team. Last updated May 2026.