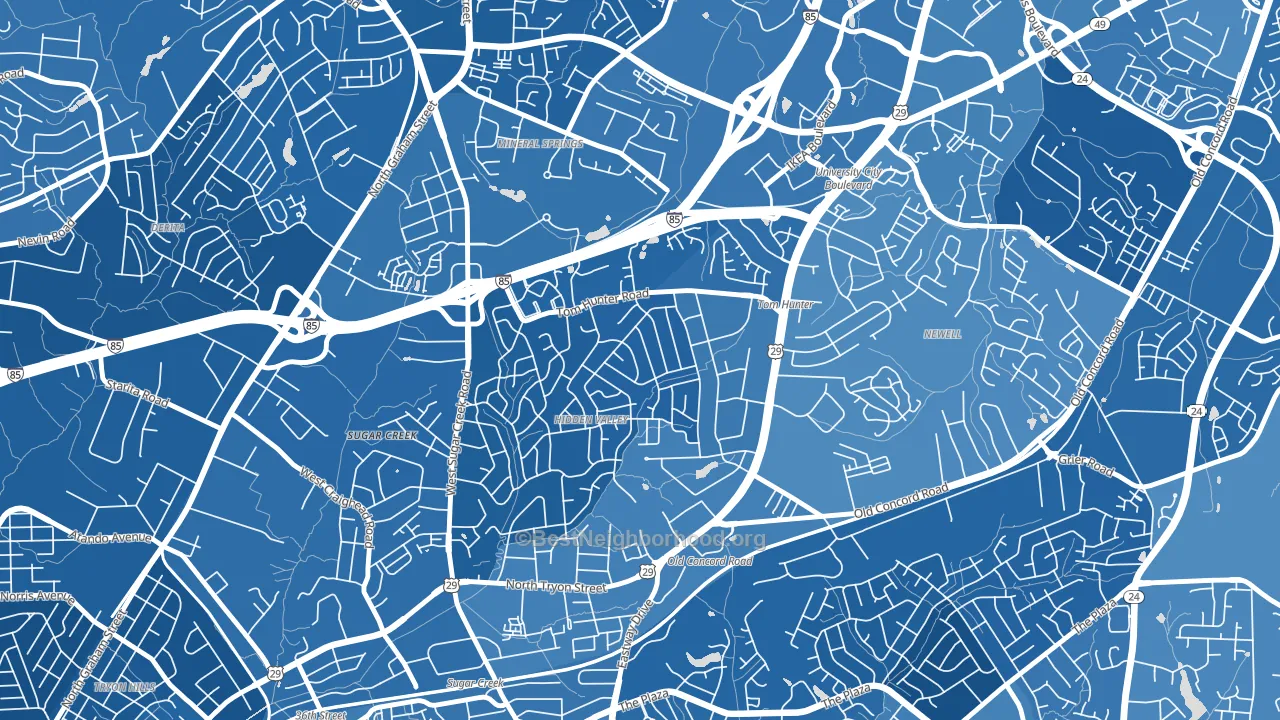
Hidden Valley is a Democratic stronghold. About 84% of voters here vote Democratic and 16% Republican.
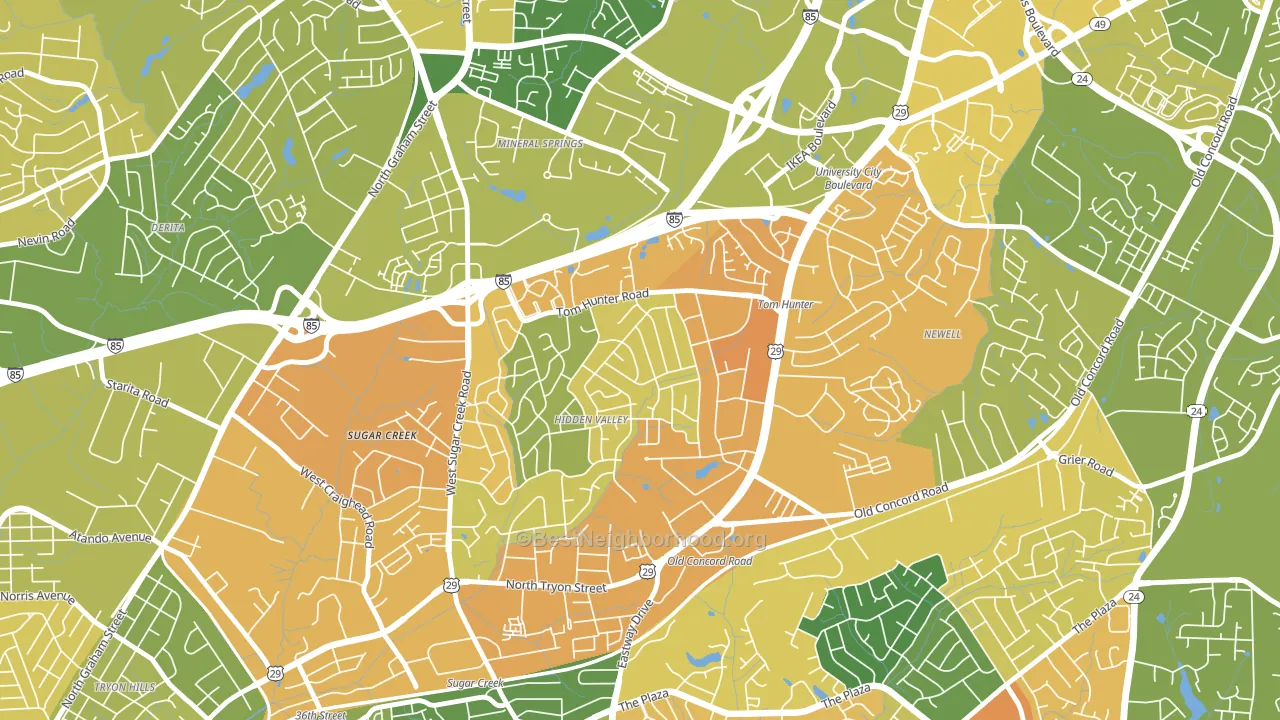
About 46% of adults in Hidden Valley typically vote, below the U.S. average of about 62%. Among adults in Hidden Valley, ~39% vote Democratic, ~7% Republican, and ~54% don't vote. The map below shows estimated turnout by block group.
How Hidden Valley compares
Among neighborhoods within 5 miles, Hidden Valley leans more Democratic than 21 of 27 neighbors.
Hidden Valley runs about 71 points more Democratic than North Carolina as a whole. North Carolina leans Republican overall, while Hidden Valley is one of the few Democratic-leaning pockets.
Politics vary noticeably by block within Hidden Valley. The northwest side is the most Democratic-leaning (D+79) and the southeast side is the least Democratic-leaning (D+57), a spread of about 23 points.
Why Hidden Valley leans the way it does
This analysis examined 14,881 data points per neighborhood to find what predicts political lean and turnout. The items below are a few correlations that stood out for Hidden Valley, not a ranked or complete list of what matters most.
Hidden Valley votes against the grain of North Carolina. North Carolina leans Republican overall, while Hidden Valley runs about 71 points more Democratic. A high never-married share predicts Democratic voting, and about 59% of adults in Hidden Valley have never been married, above 92% of neighborhoods.
Preventive-care access and voter turnout
Places with limited routine preventive-care access tend to turn out at a lower rate; Hidden Valley, Charlotte, NC sits in the bottom tenth nationally on this measure. Dental visits do not drive turnout; the rate reflects income, insurance, and healthcare access, which line up with who votes.
Why turnout in Hidden Valley looks the way it does
Areas with limited routine healthcare access turn out at lower rates. Hidden Valley is in the bottom quarter nationally for routine-care measures such as insurance coverage, preventive screenings, and dental visits. The dental-visit rate here is about 43%, about 18 points below the North Carolina average of 61%. Renters vote less often than owners, and about 76% of households in Hidden Valley rent, compared to around 53% in nearby neighborhoods. High food insecurity lines up with lower turnout, and about 38% of adults in Hidden Valley report food insecurity, above 92% of neighborhoods. Learn more about the findings and methodology on the political spectrum map.
Nearby Neighborhoods
- Newell South, Charlotte, NC D+44
- Sugaw Creek, Charlotte, NC D+65
- Plaza-Eastway, Charlotte, NC D+74
- Mineral Springs-Rumble Road, Charlotte, NC D+62
- Derita-Statesville, Charlotte, NC D+75
- Shannon Park, Charlotte, NC D+59
- North Charlotte, Charlotte, NC D+55
- Plaza-Shamrock, Charlotte, NC D+68
- Rockwell Park-Hemphill Heights, Charlotte, NC D+72
- Oak Forest, Charlotte, NC D+65
Neighborhoods with Similar Populations
- Southeast, Eugene, OR D+63
- Bailey's Crossroads, Falls Church, VA D+44
- Brookline, Pittsburgh, PA D+23
- Berkeley Hills, Berkeley, CA D+83
- Cultural Corridor, Las Vegas, NV D+34
- Downtown Yonkers, Yonkers, NY D+48
- Savage-Guilford, Laurel, MD D+52
- South Park, Los Angeles, CA D+58
- South Englewood, Chicago, IL D+83
- Valley Station, Louisville, KY R+15
Sources and methodology
Precinct-level voting records used to fit the model come from North Carolina State Board of Elections, distributed by the Voting and Election Science Team. Demographic inputs come from the U.S. Census Bureau (ACS 5-year estimates and the 2020 Decennial Census). Health and environmental inputs come from the CDC (PLACES and the Environmental Justice Index). Land cover comes from the USGS and EPA. Election-day and lead-up weather come from PRISM 4km daily grids and the NOAA Global Historical Climatology Network. Mail-voting and election-administration patterns come from the MIT Election Lab's Survey of the Performance of American Elections. Block-group crime detail comes from CrimeGrade. Internet data and modeling support provided by ISPreports.org.
Modeling and analysis by the BestNeighborhood data science team. Full methodology and findings: political spectrum map.
Methodology reviewed by the BestNeighborhood data team. Last updated May 2026.