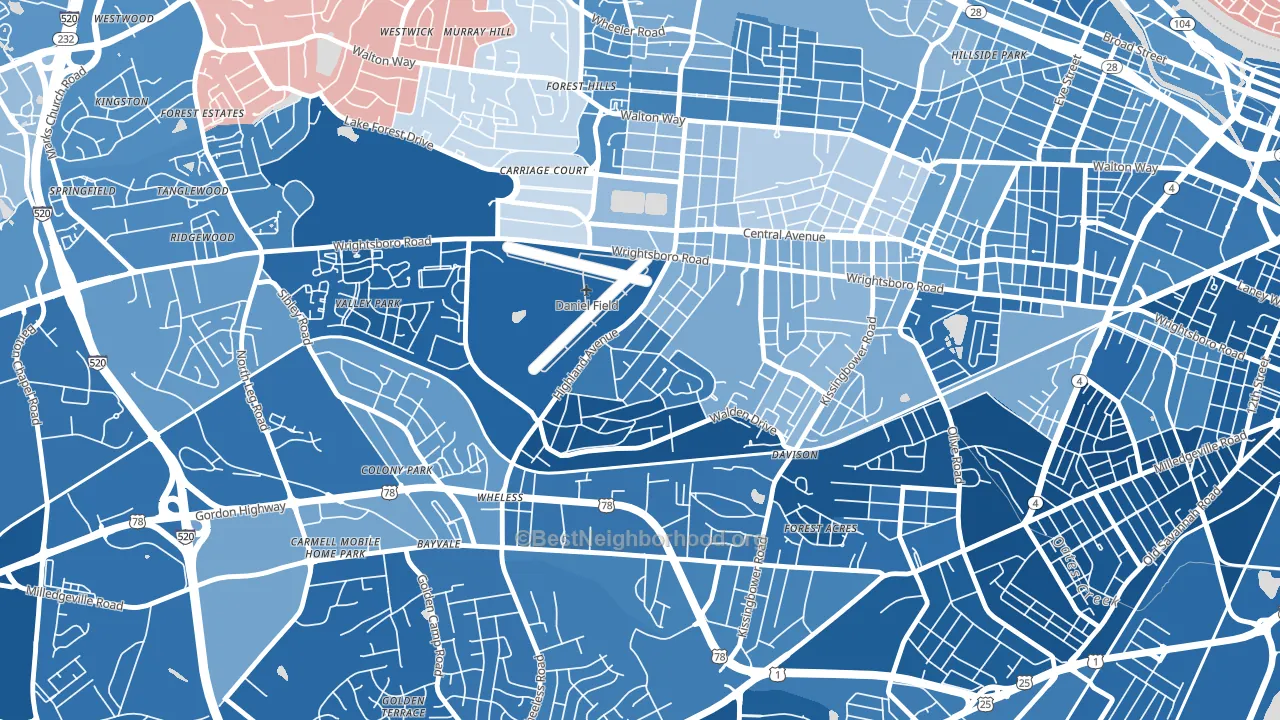
Highland Park leans heavily Democratic by roughly 46 points: about 73% of voters vote Democratic and 27% Republican.
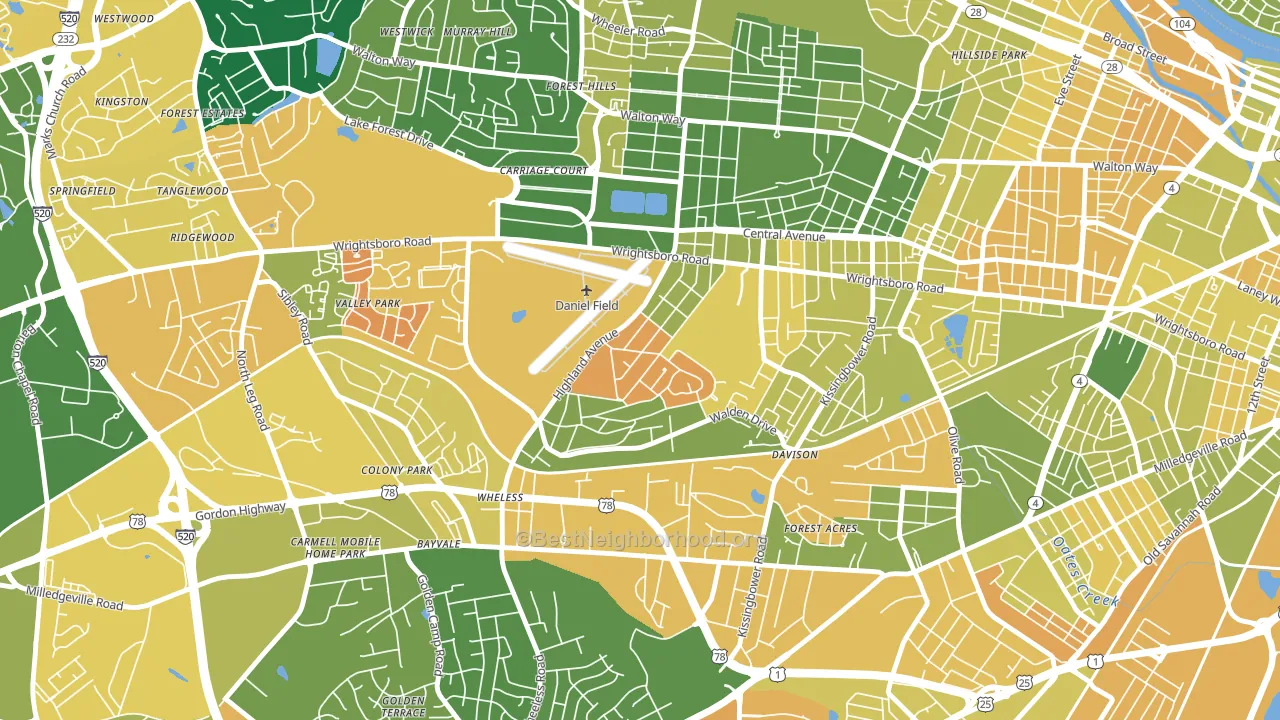
About 53% of adults in Highland Park typically vote, below the U.S. average of about 62%. Among adults in Highland Park, ~39% vote Democratic, ~14% Republican, and ~47% don't vote. The map below shows estimated turnout by block group.
How Highland Park compares
Among neighborhoods within 5 miles, Highland Park leans more Democratic than 9 of 15 neighbors.
Highland Park runs about 49 points more Democratic than Georgia as a whole. Georgia is roughly evenly split, and Highland Park sits clearly on the Democratic side.
Politics vary noticeably by block within Highland Park. The southwest side is the most Democratic-leaning (D+72) and the southeast side is the least Democratic-leaning (D+7), a spread of about 64 points.
Why Highland Park leans the way it does
This analysis examined 14,881 data points per neighborhood to find what predicts political lean and turnout. The items below are a few correlations that stood out for Highland Park, not a ranked or complete list of what matters most.
Highland Park votes against the grain of Georgia. Georgia is roughly evenly split, while Highland Park runs about 49 points more Democratic. A high never-married share predicts Democratic voting, and about 47% of adults in Highland Park have never been married, above 77% of neighborhoods.
Preventive-care access and voter turnout
Places with limited routine preventive-care access tend to turn out at a lower rate; Highland Park, Augusta, GA sits in the bottom quarter nationally on this measure. Dental visits do not drive turnout; the rate reflects income, insurance, and healthcare access, which line up with who votes.
Why turnout in Highland Park looks the way it does
Renters vote less often than owners. About 70% of households in Highland Park rent, about 45 points above the U.S. average of 25%. High-crime urban areas turn out at lower rates, and Highland Park sits in the top 15% on a violent-crime measure. Learn more about the findings and methodology on the political spectrum map.
Nearby Neighborhoods
- Forrest Hills, Augusta, GA D+29
- Summerville, Augusta, GA D+14
- North Leg, Augusta, GA D+50
- Wheeless Road, Augusta, GA D+63
- Lake Aumond, Augusta, GA D+25
- Richmond Hill, Augusta, GA D+56
- West Augusta, Augusta, GA D+6
- Old Savannah, Augusta, GA D+40
- Barton Chapel, Augusta, GA D+73
- Montclair, Augusta, GA Even
Neighborhoods with Similar Populations
- Pleasant Grove East, Chesapeake, VA R+34
- Scarritt Renaissance, Kansas City, MO D+48
- The Coves, Kansas City, MO D+14
- Top Road, Trenton, NJ D+36
- Far Northeast-Huffman, Huffman, TX R+52
- Snohomish Cascade, Silver Firs, WA D+8
- Kent Corner, Riverside, RI D+5
- Kensington, San Diego, CA D+57
- Pimlico, Baltimore, MD D+85
- Frenchtown, Westbrook, ME D+23
Sources and methodology
Precinct-level voting records used to fit the model come from Georgia Elections Division, distributed by the Voting and Election Science Team. Demographic inputs come from the U.S. Census Bureau (ACS 5-year estimates and the 2020 Decennial Census). Health and environmental inputs come from the CDC (PLACES and the Environmental Justice Index). Land cover comes from the USGS and EPA. Election-day and lead-up weather come from PRISM 4km daily grids and the NOAA Global Historical Climatology Network. Mail-voting and election-administration patterns come from the MIT Election Lab's Survey of the Performance of American Elections. Block-group crime detail comes from CrimeGrade. Internet data and modeling support provided by ISPreports.org.
Modeling and analysis by the BestNeighborhood data science team. Full methodology and findings: political spectrum map.
Methodology reviewed by the BestNeighborhood data team. Last updated May 2026.