The Coves leans slightly Democratic by roughly 14 points: about 57% of voters vote Democratic and 43% Republican.
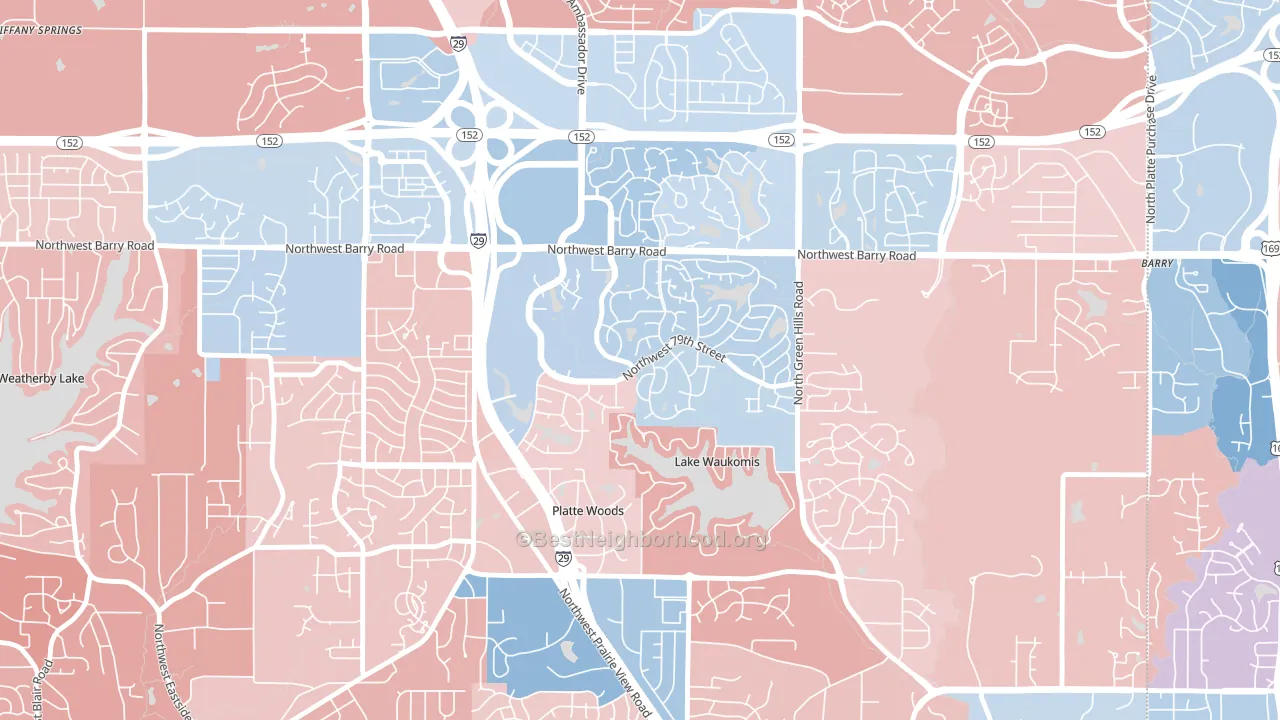
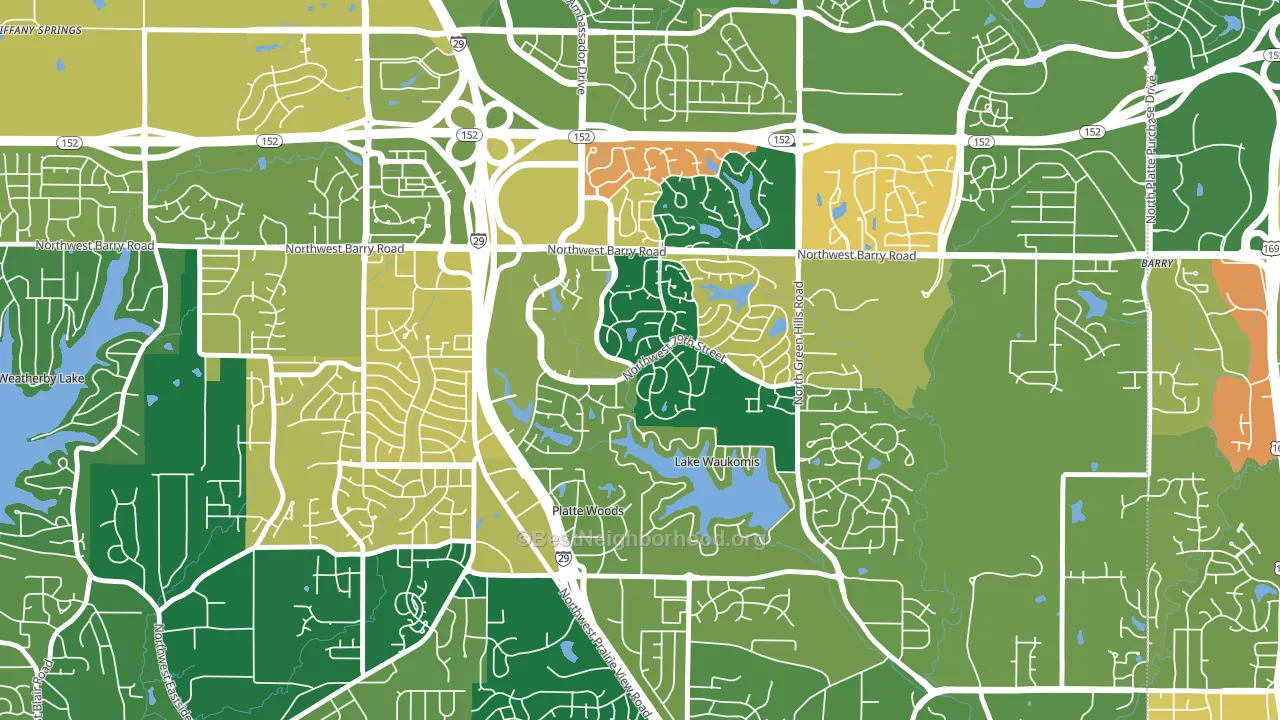
About 79% of adults in The Coves typically vote, above the U.S. average of about 62%. Among adults in The Coves, ~45% vote Democratic, ~34% Republican, and ~21% don't vote. The map below shows estimated turnout by block group.
How The Coves compares
Among neighborhoods within 5 miles, The Coves is the most Democratic-leaning.
The Coves runs about 32 points more Democratic than Missouri as a whole. Missouri leans Republican overall, while The Coves is one of the few Democratic-leaning pockets.
Why The Coves leans the way it does
This analysis examined 14,881 data points per neighborhood to find what predicts political lean and turnout. The items below are a few correlations that stood out for The Coves, not a ranked or complete list of what matters most.
The Coves votes against the grain of Missouri. Missouri leans Republican overall, while The Coves runs about 32 points more Democratic. High college attainment predicts Democratic voting, and The Coves sits in the top quarter (about 56%, above 77% of neighborhoods).
Cancer-screening access and voter turnout
Places with high colon-cancer-screening access tend to turn out at a higher rate; The Coves, Kansas City, MO sits in the top quarter nationally on this measure. Cancer screening does not drive turnout; it reflects income, insurance, and healthcare access.
Why turnout in The Coves looks the way it does
Areas with strong routine healthcare access turn out at higher rates. The Coves is in the top quarter nationally for routine-care measures such as insurance coverage, preventive screenings, and dental visits. The dental-visit rate here is about 69%, about 9 points above the U.S. average of 60%. High high-school completion lines up with higher turnout, and more than 99% of adults in The Coves have completed high school, above 95% of neighborhoods. Learn more about the findings and methodology on the political spectrum map.
Nearby Neighborhoods
- Coves North, Kansas City, MO D+9
- Platte Brook North, Kansas City, MO D+9
- Park Forest, Kansas City, MO D+12
- Prairie Point-Wildberry, Kansas City, MO D+6
- Barry Harbour, Kansas City, MO D+13
- Breen Hills, Kansas City, MO D+7
- Parkdale-Walden, Kansas City, MO D+8
- Clayton, Kansas City, MO D+9
- Lakeview Terrace, Kansas City, MO D+14
- Gashland, Kansas City, MO R+4
Neighborhoods with Similar Populations
- Pleasant Grove East, Chesapeake, VA R+34
- Scarritt Renaissance, Kansas City, MO D+48
- Snohomish Cascade, Silver Firs, WA D+8
- Far Northeast-Huffman, Huffman, TX R+52
- Highland Park, Augusta, GA D+47
- Frenchtown, Westbrook, ME D+23
- Cooper Park, Bozeman, MT D+44
- Audubon Park, Minneapolis, MN D+67
- Lucas, Iowa City, IA D+45
- Hot Wells, San Antonio, TX D+29
Sources and methodology
Precinct-level voting records used to fit the model come from Missouri Secretary of State, Elections, distributed by the Voting and Election Science Team. Demographic inputs come from the U.S. Census Bureau (ACS 5-year estimates and the 2020 Decennial Census). Health and environmental inputs come from the CDC (PLACES and the Environmental Justice Index). Land cover comes from the USGS and EPA. Election-day and lead-up weather come from PRISM 4km daily grids and the NOAA Global Historical Climatology Network. Mail-voting and election-administration patterns come from the MIT Election Lab's Survey of the Performance of American Elections. Block-group crime detail comes from CrimeGrade. Internet data and modeling support provided by ISPreports.org.
Modeling and analysis by the BestNeighborhood data science team. Full methodology and findings: political spectrum map.
Methodology reviewed by the BestNeighborhood data team. Last updated May 2026.