Highland Park is a Democratic stronghold. About 87% of voters here vote Democratic and 13% Republican.
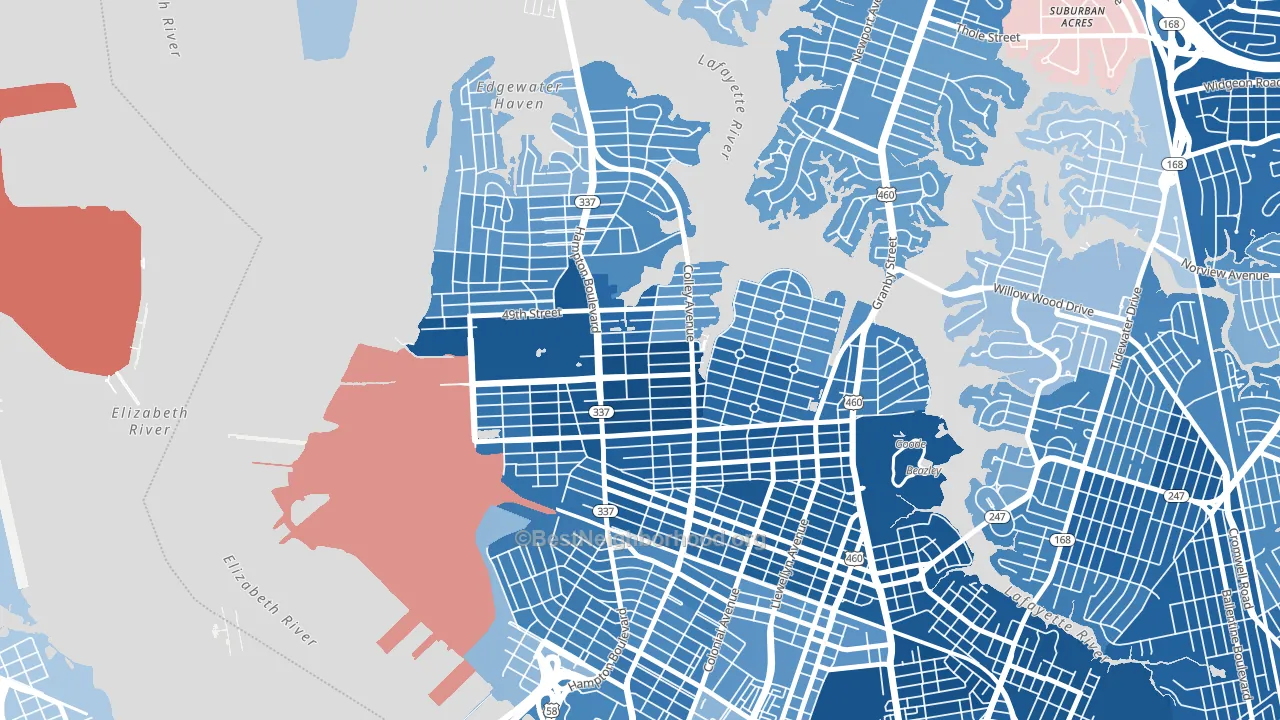
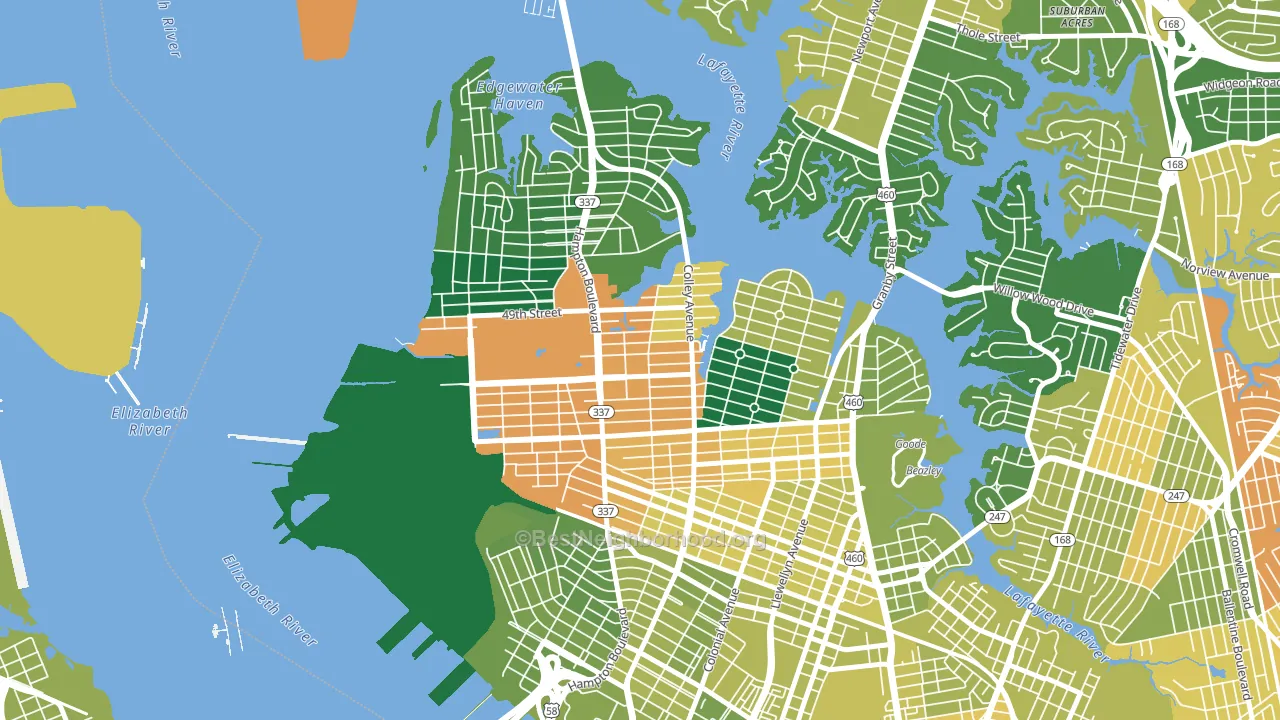
About 41% of adults in Highland Park typically vote, below the U.S. average of about 62%. Among adults in Highland Park, ~36% vote Democratic, ~5% Republican, and ~59% don't vote. The map below shows estimated turnout by block group.
How Highland Park compares
Among neighborhoods within 5 miles, Highland Park leans more Democratic than 15 of 17 neighbors.
Highland Park runs about 67 points more Democratic than Virginia as a whole.
Politics vary noticeably by block within Highland Park. The east side is the most Democratic-leaning (D+80) and the northeast side is the least Democratic-leaning (D+51), a spread of about 28 points.
Why Highland Park leans the way it does
This analysis examined 14,881 data points per neighborhood to find what predicts political lean and turnout. The items below are a few correlations that stood out for Highland Park, not a ranked or complete list of what matters most.
Areas with many never-married adults vote Democratic. About 84% of adults in Highland Park have never been married, far above similar-sized neighborhoods (around 40%).
Walkability and Democratic lean
Places with a highly walkable street grid tend to lean Democratic; Highland Park, Norfolk, VA sits in the top tenth nationally on this measure. A walkable street grid does not change how people vote; it mostly reflects how urban a place is.
Why turnout in Highland Park looks the way it does
Renters vote less often than owners. About 86% of households in Highland Park rent, about 61 points above the U.S. average of 25%. High food insecurity lines up with lower turnout, and about 30% of adults in Highland Park report food insecurity, above 83% of neighborhoods. High-crime urban areas turn out at lower rates, and Highland Park sits in the top 15% on a violent-crime measure. Learn more about the findings and methodology on the political spectrum map.
Nearby Neighborhoods
- Lamberts Point, Norfolk, VA D+67
- Colonial Place Riverview, Norfolk, VA D+61
- Larchmont-Edgewater, Norfolk, VA D+31
- Park Place, Norfolk, VA D+72
- Ghent, Norfolk, VA D+49
- Lindenwood, Norfolk, VA D+80
- Ghent Square, Norfolk, VA D+39
- Fairmont Park, Norfolk, VA D+63
- North Meadow Brook, Norfolk, VA D+29
- Downtown Norfolk, Norfolk, VA D+61
Neighborhoods with Similar Populations
- Capitol Hill, Oklahoma City, OK D+23
- Woodside Cotton Mill Historic District, Parker, SC D+36
- Santa Clara Heights, Santa Clara, UT R+56
- Royal Ridge, San Antonio, TX D+9
- Lauraville, Baltimore, MD D+75
- Craig Farms, Port Orange, FL R+31
- Greens of McKinney, McKinney, TX R+2
- Northwood Hills, West Palm Beach, FL D+61
- Southeast Growth Area, Fresno, CA R+34
- Downtown West, Gary, IN D+84
Sources and methodology
Precinct-level voting records used to fit the model come from Virginia Department of Elections, distributed by the Voting and Election Science Team. Demographic inputs come from the U.S. Census Bureau (ACS 5-year estimates and the 2020 Decennial Census). Health and environmental inputs come from the CDC (PLACES and the Environmental Justice Index). Land cover comes from the USGS and EPA. Election-day and lead-up weather come from PRISM 4km daily grids and the NOAA Global Historical Climatology Network. Mail-voting and election-administration patterns come from the MIT Election Lab's Survey of the Performance of American Elections. Block-group crime detail comes from CrimeGrade. Internet data and modeling support provided by ISPreports.org.
Modeling and analysis by the BestNeighborhood data science team. Full methodology and findings: political spectrum map.
Methodology reviewed by the BestNeighborhood data team. Last updated May 2026.